


July 28, 2026
Jennifer Timmerman, Investment Strategy Analyst
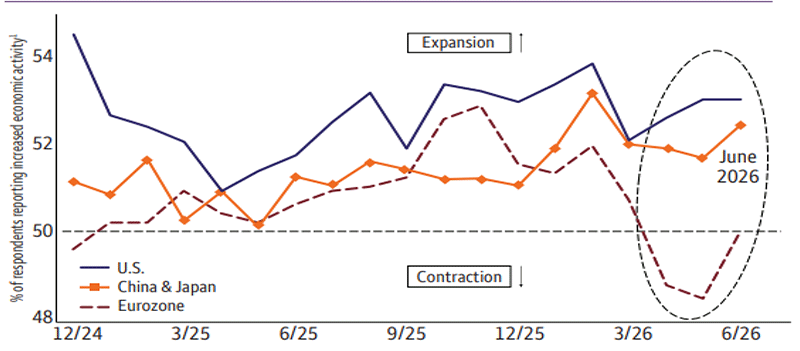
AI-oriented economies on top
 Sources: Wells Fargo Investment Institute, S&P Global, Inc., Institute for Supply Management (ISM), China Federation of Logistics & Purchasing, and RatingDog. Data as of July 6, 2026. 1. Based on composite purchasing managers' indexes covering manufacturing and services activity. Excerpted from Asset Allocation Strategy Report (July 16).
Artificial intelligence (AI) continues to drive global growth
The above chart illustrates a clear dichotomy in global economic growth in recent months. A broad measure of economic activity in the U.S., as well as China and Japan, held firmly in expansionary territory in June, largely supported by AI-related investment. Meanwhile, activity in the eurozone lagged, weighed down by a relatively small technology sector and more limited exposure to the AI capital expenditure boom.
Looking ahead, some economic performance convergence may occur later this year, once supply chains begin to normalize following what we anticipate will eventually be a renegotiated U.S.-Iran ceasefire. This should benefit trade-sensitive Europe most, but the AI-related gap in performance still is likely to remain wide by historical standards, propelling the U.S. and certain economies in northern Asia, including South Korea and Taiwan.
What it may mean for investors
We favor U.S. over international assets, while using market pullbacks as potential buying opportunities to bring international portfolio allocations up to neutral, especially in areas tied to the AI boom. Within the U.S., we favor Large Cap Equities, especially Financials, Information Technology, Materials, and Utilities. In fixed income, we prefer short-term securities (1-3 year-maturities), and we also favor Commodities which can serve as a potential inflation hedge.
Risk Considerations
Each asset class has its own risk and return characteristics. The level of risk associated with a particular investment or asset class generally correlates with the level of return the investment or asset class might achieve. Stock markets, especially foreign markets, are volatile. Stock values may fluctuate in response to general economic and market conditions, the prospects of individual companies, and industry sectors. Foreign investing has additional risks including those associated with currency fluctuation, political and economic instability, and different accounting standards. These risks are heightened in emerging markets. Bonds are subject to market, interest rate, price, credit/default, liquidity, inflation, and other risks. Prices tend to be inversely affected by changes in interest rates. The commodities markets are considered speculative, carry substantial risks, and have experienced periods of extreme volatility. Investing in a volatile and uncertain commodities market may cause a portfolio to rapidly increase or decrease in value which may result in greater share price volatility. Sector investing can be more volatile than investments that are broadly diversified over numerous sectors of the economy and will increase a portfolio’s vulnerability to any single economic, political, or regulatory development affecting the sector. This can result in greater price volatility.
General Disclosures
Global Investment Strategy (GIS) is a division of Wells Fargo Investment Institute, Inc. (WFII). WFII is a registered investment adviser and wholly owned subsidiary of Wells Fargo Bank, N.A., a bank affiliate of Wells Fargo & Company.
The information in this report was prepared by Global Investment Strategy. Opinions represent GIS’ opinion as of the date of this report and are for general information purposes only and are not intended to predict or guarantee the future performance of any individual security, market sector or the markets generally. GIS does not undertake to advise you of any change in its opinions or the information contained in this report. Wells Fargo & Company affiliates may issue reports or have opinions that are inconsistent with, and reach different conclusions from, this report.
The information contained herein constitutes general information and is not directed to, designed for, or individually tailored to, any particular investor or potential investor. This report is not intended to be a client-specific suitability or best interest analysis or recommendation, an offer to participate in any investment, or a recommendation to buy, hold or sell securities. Do not use this report as the sole basis for investment decisions. Do not select an asset class or investment product based on performance alone. Consider all relevant information, including your existing portfolio, investment objectives, risk tolerance, liquidity needs and investment time horizon. The material contained herein has been prepared from sources and data we believe to be reliable but we make no guarantee to its accuracy or completeness.
Wells Fargo Advisors is registered with the U.S. Securities and Exchange Commission and the Financial Industry Regulatory Authority, but is not licensed or registered with any financial services regulatory authority outside of the U.S. Non-U.S. residents who maintain U.S.-based financial services account(s) with Wells Fargo Advisors may not be afforded certain protections conferred by legislation and regulations in their country of residence in respect of any investments, investment transactions or communications made with Wells Fargo Advisors.
Wells Fargo Advisors is a trade name used by Wells Fargo Clearing Services, LLC and Wells Fargo Advisors Financial Network, LLC, Members SIPC, separate registered broker-dealers and non-bank affiliates of Wells Fargo & Company.