Seek stability through diversification
“War is merely the continuation of policy by other means.” The 19th-century Prussian general and military theorist Carl von Clausewitz offered great insight on why the tragedy of war has repeatedly occurred in history. In a loose sense, there has been no shortage of domestic and international conflicts because of policy disagreements in 2025. Geopolitical conflicts are difficult to forecast and can create uncertainty for investors. Even tougher to predict is how asset classes would react to schism, smoke, and shocks. How should today’s investors navigate through the known unknowns?
Take the recent Israel-Iran conflict as an example. Few could have foreseen the 10% spike in Brent crude oil as the war quickly escalated in mid-June. After the U.S. military struck three key Iranian nuclear sites on June 21, investors experienced a near 9% intraday decline in Brent crude on June 23 while the S&P 500 Index reversed its initial decline and trended into positive territory as the market viewed the Iranian retaliation as symbolic and restrained. The U.S. announced an Israel-Iran ceasefire after the market closed on June 23. This sequence of events and subsequent market reactions would have been difficult for market participants to forecast. However, if long-term investors maintained suitable Commodities and U.S. Large Cap Equities weightings in their portfolios, they would have gained from adequate risk exposure while allowing fixed income to tame net portfolio volatility.
The intense Israel-Iran skirmish de-escalated quickly after the U.S. military strikes and contained Iranian retaliation, but the risks involved created uncertainty in the moment, even though the de-escalation came quickly. The conflict exemplifies how challenging it is to predict market-moving events, but in our view, portfolio risks can be managed.
Looking ahead, investors face more policy and geopolitical risks that may not be so quickly contained. Asset classes may respond to event risks differently; owning multiple negative-to-low-correlation asset classes could help cushion the level of downside risks. Put simply, we believe a diversified allocation remains an effective strategy to help investors navigate through turbulent markets by maintaining exposure to asset classes, such as equities and fixed income, whose prices historically have tended to move in opposite directions in turbulent times.
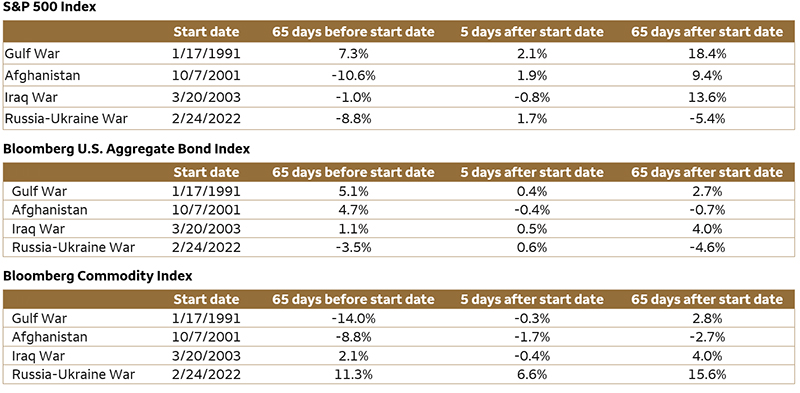
Table 1 shows that in the aftermath of major geopolitical conflicts since 1991, U.S. Large Cap Equities, as measured by the S&P 500 Index, generally suffered ahead of the war, but performance 65 days later was positive in three of the four instances. Fixed-income asset class performance was mostly positive ahead of the conflict and mixed thereafter. Commodities performance was mixed as energy is a main strategic asset in most of these regions. Drivers for each geopolitical conflict were different, so past performance is not an indication of future returns. Also, geopolitical risks are not the only influence on markets when we expand the time horizon. The varied performance among asset classes shows that when facing known unknowns, diversification is important.
Table 1: Asset-class performance varied before and after past geopolitical conflicts
|
Start date |
65 days before start date |
5 days after start date |
65 days after start date |
| Gulf War |
1/17/1991 |
7.3% |
2.1% |
18.4% |
| Afghanistan |
10/7/2001 |
-10.6% |
1.9% |
9.4% |
| Iraq War |
3/20/2003 |
-1.0% |
-0.8% |
13.6% |
| Russia-Ukraine War |
2/24/2022 |
-8.8% |
1.7% |
-5.4% |
|
Start date |
65 days before start date |
5 days after start date |
65 days after start date |
| Gulf War |
1/17/1991 |
5.1% |
0.4% |
2.7% |
| Afghanistan |
10/7/2001 |
4.7% |
-0.4% |
-0.7% |
| Iraq War |
3/20/2003 |
1.1% |
0.5% |
4.0% |
| Russia-Ukraine War |
2/24/2022 |
-3.5% |
0.6% |
-4.6% |
|
Start date |
65 days before start date |
5 days after start date |
65 days after start date |
| Gulf War |
1/17/1991 |
-14.0% |
-0.3% |
2.8% |
| Afghanistan |
10/7/2001 |
-8.8% |
-1.7% |
-2.7% |
| Iraq War |
3/20/2003 |
2.1% |
-0.4% |
4.0% |
| Russia-Ukraine War |
2/24/2022 |
11.3% |
6.6% |
15.6% |
Sources: Bloomberg and Wells Fargo Investment Institute. Data as of June 23, 2025.
S&P 500 Index is a market capitalization-weighted index composed of 500 widely held common stocks that is generally considered representative of the U.S. stock market. Returns assume reinvestment of dividends and capital gain distributions.
Bloomberg U.S. Aggregate Bond Index is composed of the Bloomberg Capital U.S. Government/Credit Index and the Bloomberg Capital U.S. Mortgage-Backed Securities Index, and includes Treasury issues, agency issues, corporate bond issues, and mortgage-backed securities.
Bloomberg Commodity Index is calculated on an excess return basis and reflects commodity futures price movements. An index is unmanaged and not available for direct investment.
Past performance does not indicate future returns.
What should investors do?
During periods of geopolitical volatility, we prefer a diversified asset allocation for two main purposes: 1) to maintain adequate risk exposure to asset classes that have the potential to gain, and 2) to help manage downside risks in case events take an unexpected turn against our risk positioning.
Geopolitical events may rapidly escalate or de-escalate as the recent Israel-Iran conflict has demonstrated. We remind investors that there are more extended policy disagreements looming, such as the ongoing trade negotiations and fiscal-budget debate — both facing upcoming deadlines.
We believe it may make sense to hold a cash buffer given that money market rates today are higher than they were pre-COVID. As geopolitical tensions de-escalate, investors could redeploy cash into the desired asset classes.
For investors who already have cash on the sidelines and are seeking investment opportunities, our equity guidance favors high-quality assets, such as U.S. Large Cap and Mid Cap Equities over Small Cap Equities. Within the international space, we favor Developed Market ex-U.S. Equities over Emerging Market Equities as the emerging economies depend more on trade than developed economies. As investors review their risk tolerance, we suggest holding appropriate fixed-income allocations, which can benefit from perceived flight-to-safety trades and can earn an attractive yield. Within fixed income, we favor the intermediate term (3 to 7 years), and we see opportunities in essential-service municipal bonds as well.
Retesting the highs
The S&P 500 Index has climbed 22.26% from April 8 to June 24, and sits just below the all-time high of 6144, reached on February 19, 2025. The rebound in prices has been driven by a delay in reciprocal tariffs to early July, a trade détente between the U.S. and China, continued solid economic and earnings data, and expectations that the decline in inflation will set the stage for Federal Reserve (Fed) rate cuts. Unfortunately, the sharp price recovery and higher starting valuations mean investor expectations are loftier and the road to further gains much harder.
The tariff deadline still sits looming in early July, along with simmering geopolitics, the sprint to finish the One Big Beautiful Bill Act, and the need to raise the debt ceiling; any of these could lead to additional volatility. Also, economic data and earnings, while solid in the last few quarters, were boosted by the frontloading of demand ahead of tariff implementation and are expected to cool. Given these potential event risks and the fact that the S&P 500 Index sits close to our year-end target range of 6,000 – 6,200 we recommend investors rebalance portfolios, which may involve opportunistically trimming equities and rotating funds into fixed income.
The chart shows the S&P 500 Index (6092) is in a downtrend, with the 50-day moving average (5765) now trading below the 200-day moving average (5819). It should find support at the 200-day moving average (5819) followed by the 50-day moving average (5765). Resistance sits at the all-time high (6144).
S&P 500 Index back at the highs and overbought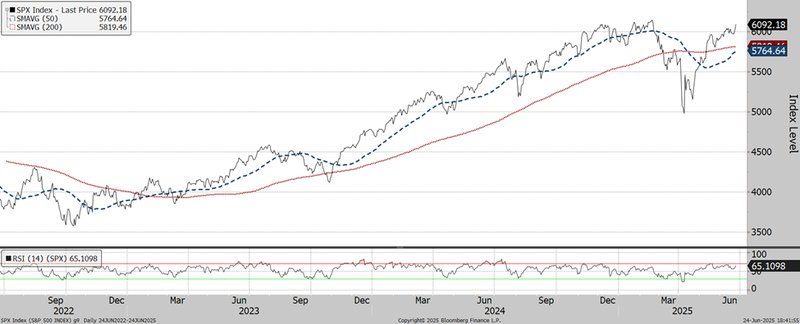
Sources: Bloomberg and Wells Fargo Investment Institute. Daily data from June 24, 2022, through June 24, 2025. SPX = S&P 500 Index. SMAVG (50) = 50-day simple moving average. SMAVG (200) = 200-day simple moving average. RSI = relative strength index. An index is unmanaged and not available for direct investment.
Past performance does not indicate future returns.
CMBS market holds steady, but headwinds linger
Headwinds in the commercial real estate (CRE) sector are widely known, and our belief is that the conditions in CRE could deteriorate as rising delinquencies, falling asset prices, and softening fundamentals weigh on investor sentiment. The prospects of an economic slowdown in the upcoming months remain, especially since the Fed is not in a hurry to act. Therefore, the CRE sector remains under pressure, particularly in the Office, Retail and Multifamily space. However, modification rates continue to move higher as borrowers receive extensions while lenders avoid taking immediate losses, foreclosures, and forced liquidations.
Despite these challenges, commercial mortgage-backed securities (CMBS) spreads have remained surprisingly resilient — particularly in higher-rated tranches, tracking closely with investment-grade (IG) corporate credit. But the CMBS market continues to differentiate among the various credits. Beneath the surface, risks remain — particularly in lower-rated segments, which are more reflective of the real-world conditions facing CRE borrowers and lenders. Our bias is that credit spreads could remain around current levels or could move higher if sentiment deteriorates amid tighter credit conditions. For now, we maintain a neutral guidance on CMBS.
Also, rating agencies have continued to downgrade credit ratings and apply renewed scrutiny to CMBS in reaction to pressures converging around cash flows, the demand for commercial real estate space (especially in the office and multifamily sector), and ultimately around property valuations themselves. For investors willing to bear the risk, we prefer higher quality and short-to-intermediate duration in the AAA CMBS sectors. CMBS represent less than 2% of the Bloomberg U.S. Aggregate Bond Index, hence investors should be aware that these investments can be somewhat illiquid.
CMBS credit spreads tracking closely with IG corporates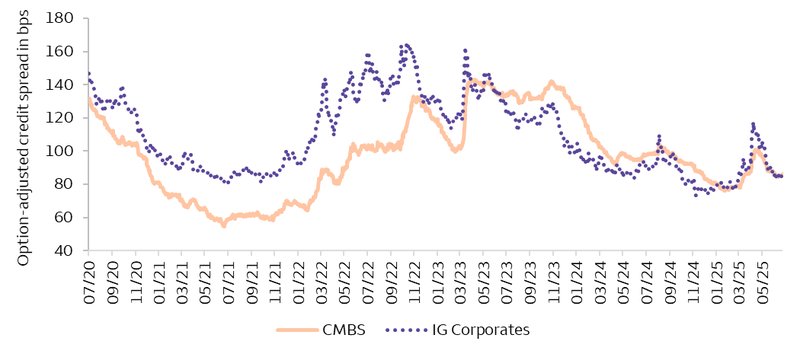
Sources: Wells Fargo Investment Institute and Bloomberg as of June 24, 2025. Daily data from July 1, 2020, to June 24, 2025. Bps = basis points. CMBS spreads are represented by the Bloomberg Commercial Mortgage-Backed Securities Index. Investment-grade (IG) Corporates are represented by the Bloomberg IG Corporate Bond Index. An index is unmanaged and not available for direct investment.
Past performance does not indicate future returns. Indexes defined in back.
Keeping it all Strait (of Hormuz)
call out “Confidence comes from being prepared.”
— John Wooden end call out
Recent events have shown the impact that threats to the Strait of Hormuz can have on oil markets. What makes this waterway so significant? The strait connects the major producers in the Persian Gulf region to consumers across the globe. A massive 20% of the world’s oil consumption flows through the Strait. At its narrowest, it is only 21 miles wide, but the navigable portion for large tankers is a mere few miles. The narrowness, sheer volume of oil that flows through the Strait, and lack of viable alternative routes is why the Strait of Hormuz is widely considered the most important oil choke point in the world.
As we have written previously, we believe a full shutdown of the Strait of Hormuz is highly unlikely, and the recent Israel-Iran truce suggests the risk of such a scenario has fallen even further. Yet, “what if” questions persist. Fortunately, U.S. dependence on oil from the Persian Gulf region has been greatly reduced in recent years (see chart). Only 400,000 barrels of oil per day, or 7% of total imports, were imported into the U.S. through the Strait in the first quarter.2 This insulates the U.S. to an extent from conflicts in the area. Yet, as oil is a globally traded commodity, we expect that any significant supply disruption would drive prices higher worldwide, impacting consumption, inflation, and economic growth.
We believe overweighting the Energy equity sector as well as the Commodities asset class with exposure to gold and oil provides attractive hedges against this and other geopolitical risks. We also expect these assets to benefit from the modest economic rebound we foresee through 2026.
U.S. oil imports from Persian Gulf not what they used to be 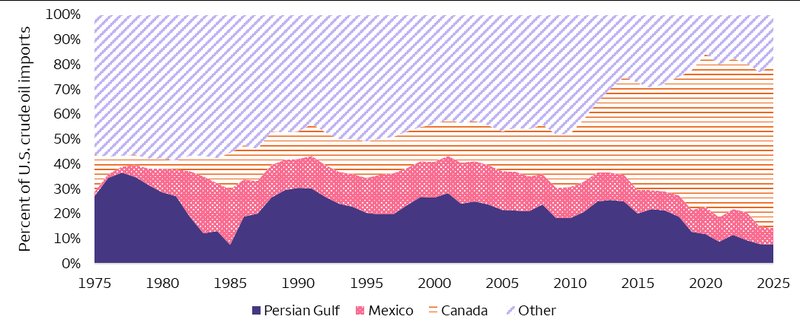
Sources: Energy Information Administration and Wells Fargo Investment Institute. Annual data is from 1975 – 2025. 2025 is based on average imports from January – March. Persian Gulf countries include Bahrain, Iran, Iraq, Kuwait, Qatar, Saudi Arabia, and the United Arab Emirates. "Other" includes all sources of U.S. crude oil imports from countries other than Persian Gulf countries, Mexico, and Canada.
2 “Amid regional conflict, the Strait of Hormuz remains critical oil chokepoint,” U.S. Energy Information Administration, June 16, 2025.
Favored hedge-fund strategies had a solid start to 2025
We believe hedge funds have the potential to help qualified investors navigate changing market conditions, as many strategies strive to stay flexible by adjusting their positioning as macroeconomic and policy landscapes evolve. As an example, during the first five months of 2025, the four hedge-fund sub-strategies that we favor (Macro – Discretionary, Equity Hedge – Directional, Relative Value – Long/Short Credit, and Event Driven – Distressed Credit) generated positive returns and outperformed the global hedge-fund composite (chart below).
As a top performer, the Macro – Discretionary sub-strategy posted consecutive monthly gains totaling 5.6% from January through May. Discretionary sub-strategies also significantly outperformed Macro – Systematic sub-strategies, which incurred losses in four out of five months. Although both Macro sub-strategies may invest across currency, commodity, stock, and bond markets, Discretionary sub-strategies generally rely on subjective decision making derived from macroeconomic and fundamental analysis. As a result, we believe Discretionary sub-strategies are better equipped to adjust to the shifting policy and market conditions.
Equity Hedge – Directional sub-strategies also held up well during the volatile markets experienced this year. Through May, the strategy captured about 60% of the S&P 500 Index’s returns during positive months, but it only incurred 20% (on average) of the S&P 500 Index’s losses during months where the index declined. Looking forward, we believe both Equity Hedge – Directional and Relative Value – Long/Short Credit sub-strategies may continue to benefit from their flexible mandates that allow managers to capitalize on opportunities across equity and credit markets while mitigating risks.
Favored hedge-fund sub-strategies generated higher returns than global hedge-fund composite year to date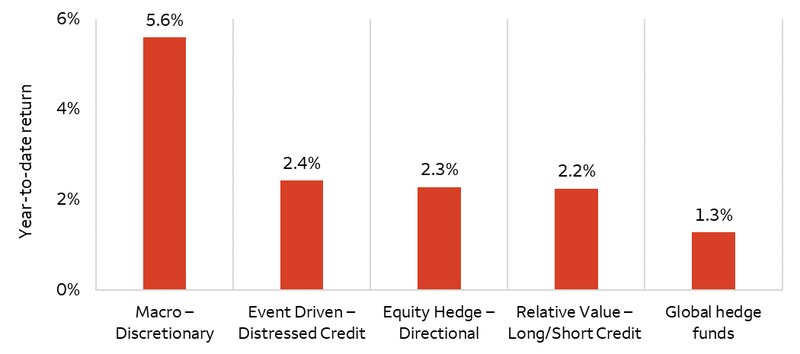
Sources: Hedge Fund Research and Wells Fargo Investment Institute. Data as of May 31, 2025. Please see the end of the report for the definitions of the indexes for each strategy and risk considerations. An index is unmanaged and not available for direct investment.
Past performance does not indicate future returns.
Please see the end of the report for the definitions of the indexes for each strategy and risk considerations.
Alternative investments, such as hedge funds, private equity, private debt and private real estate funds are not appropriate for all investors and are only open to “accredited” or “qualified” investors within the meaning of U.S. securities laws.
Cash Alternatives and Fixed Income
| Most Unfavorable |
Unfavorable |
Neutral |
Favorable |
Most Favorable |
|
intentionally blank
|
- U.S. Long Term Taxable Fixed Income
- U.S. Short Term Taxable Fixed Income
|
- Cash Alternatives
- Developed Market Ex-U.S. Fixed Income
- Emerging Market Fixed Income
- High Yield Taxable Fixed Income
- U.S. Intermediate Term Taxable Fixed Income
|
intentionally blank
|
intentionally blank
|
Equities
| Most Unfavorable |
Unfavorable |
Neutral |
Favorable |
Most Favorable |
|
intentionally blank
|
|
- Developed Market Ex-U.S. Equities
- U.S. Small Cap Equities
|
- U.S. Large Cap Equities
- U.S. Mid Cap Equities
|
intentionally blank
|
Real Assets
| Most Unfavorable |
Unfavorable |
Neutral |
Favorable |
Most Favorable |
|
intentionally blank
|
intentionally blank
|
|
|
intentionally blank
|
Alternative Investments**
| Most Unfavorable |
Unfavorable |
Neutral |
Favorable |
Most Favorable |
|
intentionally blank
|
intentionally blank
|
- Hedge Funds—Equity Hedge
- Hedge Funds—Relative Value
- Private Equity
- Private Debt
|
- Hedge Funds—Event Driven
- Hedge Funds—Macro
|
intentionally blank
|
Source: Wells Fargo Investment Institute, June 30, 2025.
*Tactical horizon is 6-18 months
**Alternative investments are not appropriate for all investors. They are speculative and involve a high degree of risk that is appropriate only for those investors who have the financial sophistication and expertise to evaluate the merits and risks of an investment in a fund and for which the fund does not represent a complete investment program. Please see end of report for important definitions and disclosures.