A sustainable Emerging Markets rally? We are skeptical
call out “History has always been a series of pendulum swings.”
— Robert Johnson end call out
Amid the tariff noise and uncertainty, the Emerging Markets (EM) Equities benchmark — the MSCI Emerging Markets Index — has outperformed the S&P 500 Index, gaining 6.9% year to date (as of May 9) compared to a 3.3% decline in the S&P 500 Index. Is this the start of sustained EM outperformance? We are skeptical.
Skeptical for a reason
The long-term EM equity track record has been uninspiring. EM earnings have barely budged since 2007, and index levels remain roughly 15% below their pre-global financial crisis highs. These figures stand in stark contrast to the S&P 500 Index, which has delivered impressive earnings growth and returns over the same period (see Chart 1). Meanwhile, a study of volatility reveals that EM experienced nearly triple the number of bear markets — defined as drops of 20% or more — during this time. In the case of EM, higher risk has not translated into higher returns these past 18 years.
Chart 1. MSCI Emerging Markets Index price and earnings growth virtually nonexistent since 2007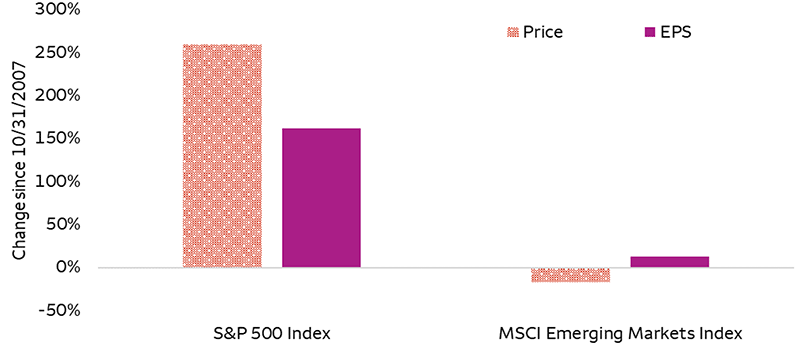
Sources: Bloomberg and Wells Fargo Investment Institute. Monthly data: October 31, 2007 – April 30, 2025. EPS = trailing 12-month earnings per share. An index is unmanaged and not available for direct investment.
Past performance is no guarantee of future results.
Some core structural issues also help to keep EM a “show me” story. These include political and economic instability, corporate governance concerns, variable regulatory risks, as well as China’s excessive debt, slumping property sector, and slowing growth brought on by the planned shift to a consumer-led economy.
What sparked the rally?
Contrary to U.S. equities, EM Equities entered 2025 on a low note. After many years of virtually nonexistent earnings growth and returns, as well as a popped Chinese real estate bubble with still-declining real estate values, EM investor pessimism was high and valuations cheap. When volatility and U.S. economic concerns escalated in early 2025, EM held up better than U.S. markets, which were priced, if not for perfection, for excellence. A string of modestly better-than-expected EM economic data prints, signs of bottoming consensus earnings expectations, China stimulus measures, and a broadly weaker U.S. dollar provided additional tailwinds to this bout of EM outperformance.
Looking ahead
We believe the EM sentiment pendulum has swung too far positive and expect an investor reawakening to the structural issues that have historically restrained these markets. In fact, in our view, trade frictions only add to the headwinds these markets will face. Additionally, a heavy consideration in our preference for U.S. over EM stocks is our forecast for a stronger U.S. dollar. History has shown that sustained EM outperformance has coincided with a consistently weaker U.S. dollar (see Chart 2).
Chart 2. EM outperformance has historically correlated with a weaker U.S. dollar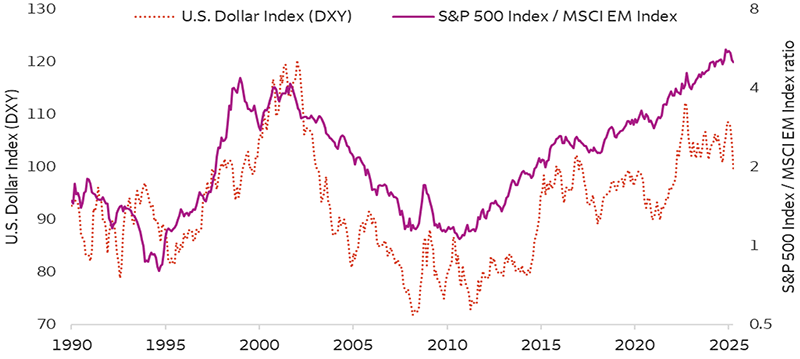
Sources: Bloomberg and Wells Fargo Investment Institute. Monthly data: January 31, 1990 – April 30, 2025. MSCI EM Index = MSCI Emerging Markets Index. When the S&P 500 Index / MSCI EM Index line is moving higher it means that the S&P 500 Index is outperforming the MSCI EM Index and vice versa. An index is unmanaged and not available for direct investment.
Past performance is no guarantee of future results.
We believe that the global economic rebound we expect later in 2025 and the eventual resolution of many trade-related concerns will push EM prices higher but that returns will lag U.S. markets. Risks are elevated in EM, where China makes up nearly 30% of the benchmark. In our view, geopolitical and significant trade frictions with China will be longer lived than those with U.S. allies (such as those in developed markets). DM have the benefit of a more stable and predictable regulatory environment, while recent news of increased fiscal spending in Europe is likely to remain a tailwind to investor opinion and returns for the asset class. Our preference for U.S. and DM Equities over EM Equities remains.
What should investors do?
For investors whose EM Equities’ allocation has crept above recommended portfolio weights, we believe the recent outperformance has provided an attractive opportunity to trim exposure to the asset class. Where to reallocate should be tailored to the specific investor profile. If it is determined that maintaining equity exposure is appropriate, consider U.S. Large Cap, U.S. Mid Cap, or DM equities. If a bigger concern is reducing equity risk, we believe Commodities or select opportunities within fixed income may be more appropriate.
Recent volatility in munis creates buying opportunity
The past several months have seen an increase in reports on the potential for changes to the tax-exempt status of municipal bonds. Budget negotiations in Congress have sparked volatility in municipal-bond markets, as in early April, an advisor to President Donald Trump publicly discussed curtailing the tax-exempt status of municipal bonds. The chart below shows that municipal yields spiked following this commentary and remain elevated.
Municipal-bond yields have spiked since early April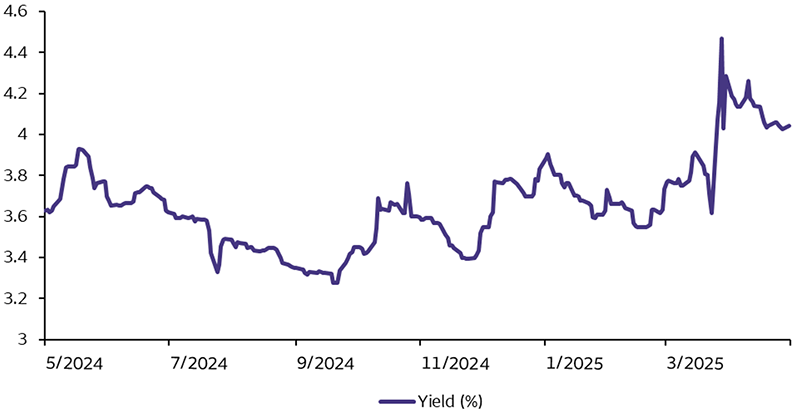
Sources: Bloomberg and Wells Fargo Investment Institute. Data as of May 13, 2025. Municipal bond yield represented by the Index yield to worst of the Bloomberg Municipal Bond Index. An index is unmanaged and not available for direct investment.
Past performance is no guarantee of future results.
We do not see any significant risks to the tax-exempt status of municipal bonds, and as a result, we see this rise in yields as a buying opportunity. Republican majorities in the House and Senate are both razor thin, meaning any controversial tax changes could withstand little disagreement before being a nonstarter. Exemption status has already received public support from some Republicans, and any proposal to remove that status is likely to significantly increase costs for state and local governments, both those in Democratic- and Republican-controlled states. Even as budget reconciliation discussions have heated up, nothing has verified exemption as a topic of discussion beyond initial commentary from a Trump advisor.
Our guidance has shifted to favorable on U.S. Municipal Bonds as a result. Municipal-to-Treasury ratios, or a comparison of yields available in municipals versus Treasuries, are still below average but represent significantly better valuations in municipals than they did prior to April. There may still be risk on the periphery, potentially in private-purpose bonds like those used to fund stadiums, but we note that these bonds are a small portion of municipals indexes. Investors should undertake meticulous, professional credit research in municipal bonds as a result of this somewhat unwarranted spike in yields.
Silver appears historically cheap as gold prices rise
When discussing precious metals, we commonly refer to gold as it accounts for 78% of the Bloomberg Precious Metals Index. However, we do also see opportunities in the lesser-weighted metal, silver, given that it appears cheap on a relative basis and could benefit from an improving macro environment through 2026.
Historically, silver and gold prices have often mirrored one another as they share many of the same monetary performance drivers. Silver, though, has lagged gold so far this year, partially due to its higher exposure to industrial activity and electronics amid widespread economic concerns. In fact, roughly 55% of global silver demand can be attributed to this industrial usage compared to only 7% for gold.1
In our view, this lagging performance makes silver appear relatively cheap on a historical basis. One way to view this relative valuation is through the gold-to-silver ratio, a measure of how many ounces of silver are needed to purchase one ounce of gold. Currently, the ratio is well above the long-term average and at the 98th percentile of readings since 2005 (see chart), suggesting that silver is at a historically cheap price.
Looking through the rest of the year and into 2026, our expectations for an improving macro environment and easing trade tensions could help stimulate global industrial activity and silver demand. While we do expect gold to continue showing strong performance given unique demand drivers like central-bank purchases, we expect the gap in performance between the two metals could narrow closer to historical averages.
As overly optimistic sentiment has pushed gold prices to frothy levels, investors looking for precious-metal exposure may find silver an attractive alternative that can also benefit from our forecasts for an improving macro outlook later this year.
Gold-to-silver ratio suggests that silver is historically cheap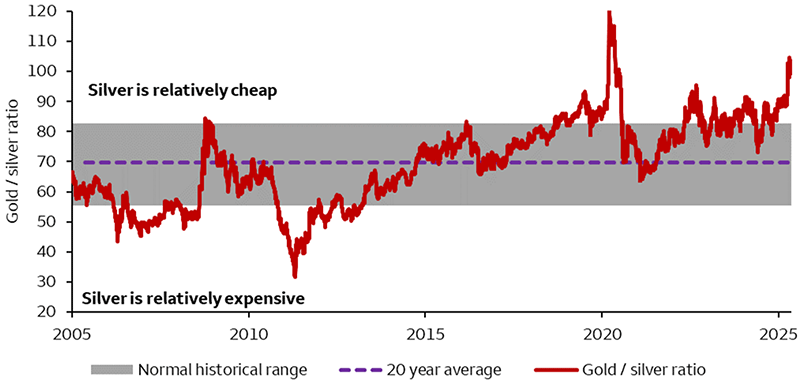
Sources: Bloomberg and Wells Fargo Investment Institute. Daily data is from January 3, 2005 – May 12, 2025. The normal historical range represents values between the 80th and 20th percentile of readings since 2005.
Past performance is no guarantee of future results.
1 Based on 2023 annual-demand data from The Silver Institute and the World Gold Council.
Private-capital distributions remain challenged
Many private-capital funds have a finite life cycle and start to return capital to investors as the funds exit underlying investments. These distributions allow investors to commit to new fundraising and help to sustain continued investments in the private markets. However, elevated interest rates, economic uncertainties, and public-market volatility since 2022 have substantially weighed on exit activities. As shown in the chart, distribution yields in 2024 have remained subdued relative to the average level observed before the coronavirus pandemic. For some strategies, like Private Real Estate and Venture Capital, distributions have approached the lows last seen in 2009.
However, income-oriented strategies (such as Private Debt and Private Infrastructure), which rely less on exits to generate distributions, showed more resilience than others (see chart). Additionally, we believe certain long-term trends also played a role in differentiating these strategies. For example, infrastructure likely benefited from the long-term tailwinds driven by artificial-intelligence buildout, the energy transition, and supply-chain restructuring. On the other hand, we believe Private Real Estate continued to be challenged not only by elevated rates, but also by supply-demand imbalances. In Private Equity, Buyout sub-strategies fared better than Venture Capital, likely owing to the higher quality of underlying businesses and a lower reliance on public listings.
We believe the current policy uncertainty and economic weakness will continue to limit private-capital distributions and pressure fundraisings over the coming months. In this environment, we prefer higher-quality Growth Equity sub-strategies as well as Small / Mid Cap Buyouts, which are less dependent on debt financing. We are also constructive on Secondaries sub-strategies, which can provide much-needed liquidity.
Private-capital distributions remained subdued in 2024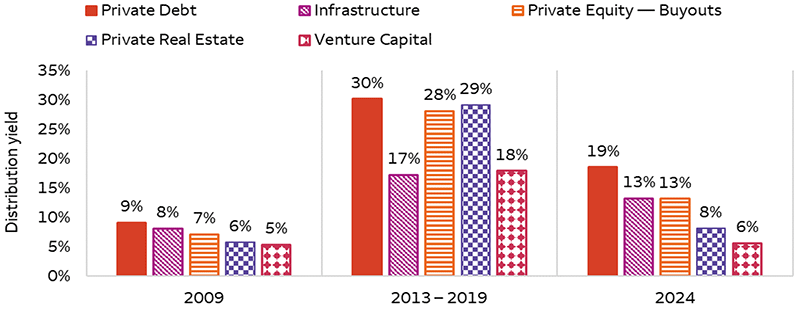
Sources: Pitchbook and Wells Fargo Investment Institute. Data as of September 30, 2024. The numbers shown in the chart are average 12-month distribution yields as a percentage of fund net asset value for 2009, 2013 to 2019, and the first three quarters of 2024, respectively. The asset classes shown are ranked from left to right based on 2024 distribution yield. Private Debt represented by PitchBook Private Debt Index. Infrastructure represented by PitchBook Infrastructure Index. Private Equity — Buyouts represented by Pitchbook Buyout Index. Private Real Estate represented by Pitchbook Private Real Estate Index. Venture Capital represented by Pitchbook Venture Capital Index. An index is unmanaged and not available for direct investment.
Past performance is no guarantee of future results.
Alternative investments, such as hedge funds, private equity, private debt and private real estate funds are not appropriate for all investors and are only open to “accredited” or “qualified” investors within the meaning of U.S. securities laws.
Cash Alternatives and Fixed Income
| Most Unfavorable |
Unfavorable |
Neutral |
Favorable |
Most Favorable |
|
intentionally blank
|
- U.S. Long Term Taxable Fixed Income
- U.S. Short Term Taxable Fixed Income
|
- Cash Alternatives
- Developed Market Ex-U.S. Fixed Income
- Emerging Market Fixed Income
- High Yield Taxable Fixed Income
- U.S. Intermediate Term Taxable Fixed Income
|
intentionally blank
|
intentionally blank
|
Equities
| Most Unfavorable |
Unfavorable |
Neutral |
Favorable |
Most Favorable |
|
intentionally blank
|
|
- Developed Market Ex-U.S. Equities
- U.S. Small Cap Equities
|
- U.S. Large Cap Equities
- U.S. Mid Cap Equities
|
intentionally blank
|
Real Assets
| Most Unfavorable |
Unfavorable |
Neutral |
Favorable |
Most Favorable |
|
intentionally blank
|
intentionally blank
|
|
|
intentionally blank
|
Alternative Investments**
| Most Unfavorable |
Unfavorable |
Neutral |
Favorable |
Most Favorable |
|
intentionally blank
|
intentionally blank
|
- Hedge Funds—Equity Hedge
- Hedge Funds—Relative Value
- Private Equity
- Private Debt
|
- Hedge Funds—Event Driven
- Hedge Funds—Macro
|
intentionally blank
|
Source: Wells Fargo Investment Institute, May 19, 2025.
*Tactical horizon is 6-18 months
**Alternative investments are not appropriate for all investors. They are speculative and involve a high degree of risk that is appropriate only for those investors who have the financial sophistication and expertise to evaluate the merits and risks of an investment in a fund and for which the fund does not represent a complete investment program. Please see end of report for important definitions and disclosures.


 Sources: Bloomberg and Wells Fargo Investment Institute. Monthly data: October 31, 2007 – April 30, 2025. EPS = trailing 12-month earnings per share. An index is unmanaged and not available for direct investment. Past performance is no guarantee of future results.
 Sources: Bloomberg and Wells Fargo Investment Institute. Monthly data: January 31, 1990 – April 30, 2025. MSCI EM Index = MSCI Emerging Markets Index. When the S&P 500 Index / MSCI EM Index line is moving higher it means that the S&P 500 Index is outperforming the MSCI EM Index and vice versa. An index is unmanaged and not available for direct investment. Past performance is no guarantee of future results.
 Sources: Bloomberg and Wells Fargo Investment Institute. Data as of May 13, 2025. Municipal bond yield represented by the Index yield to worst of the Bloomberg Municipal Bond Index. An index is unmanaged and not available for direct investment. Past performance is no guarantee of future results.
 Sources: Bloomberg and Wells Fargo Investment Institute. Daily data is from January 3, 2005 – May 12, 2025. The normal historical range represents values between the 80th and 20th percentile of readings since 2005. Past performance is no guarantee of future results.
 Sources: Pitchbook and Wells Fargo Investment Institute. Data as of September 30, 2024. The numbers shown in the chart are average 12-month distribution yields as a percentage of fund net asset value for 2009, 2013 to 2019, and the first three quarters of 2024, respectively. The asset classes shown are ranked from left to right based on 2024 distribution yield. Private Debt represented by PitchBook Private Debt Index. Infrastructure represented by PitchBook Infrastructure Index. Private Equity — Buyouts represented by Pitchbook Buyout Index. Private Real Estate represented by Pitchbook Private Real Estate Index. Venture Capital represented by Pitchbook Venture Capital Index. An index is unmanaged and not available for direct investment. Past performance is no guarantee of future results.