Natural gas demand on the rise
We believe that the outlook for U.S. natural gas demand growth has shifted structurally higher, driven by the convergence of multiple secular factors. Among the drivers of growing natural gas demand, we view increasing exports of liquefied natural gas (LNG) and growing domestic power needs as particularly significant.
Liquefied natural gas exports expanding
We view the growth in U.S. LNG exports as the most pertinent near-term driver of natural gas demand growth based on the amount of export capacity currently under construction. U.S. LNG exports have increased steadily over the past several years, and the data suggests growth is just getting started. Domestic LNG export capacity is expected to increase by 73% through the end of this decade based on projects that are already under construction. Accounting for additional proposed LNG projects that are in development, LNG capacity could potentially increase by as much as 150% over the next seven years.1
Chart 1. U.S. exports of LNG have risen steadily over the past several years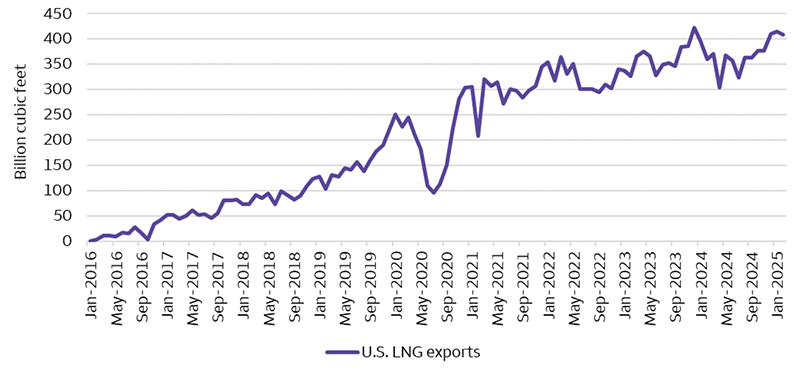
Source: EIA. Data from January 2016 – February 2025.
Data centers and power generation
The buildout of data-center capacity in the U.S. is emerging as an important demand driver of power demand. Ultimately, the impact that data centers will have on natural gas demand will depend on the cadence of development as well as a number of other variables, and current forecasts vary widely based on differing assumptions. Recent developments, such as the DeepSeek artificial intelligence breakthrough and some uncertainty around the future capital spending outlooks of hyperscalers2, have cast a shadow of doubt over the relative pace of development. However, we see no signs that the data-center boom is slowing, and we expect this trend to remain an important driver of robust electricity demand growth over the coming years.
In order to meet growing power demand, we believe that an all-of-the-above supply approach is required. This includes increasing electrification from natural gas, renewables, and nuclear facilities, and we expect significant growth across all three of these power verticals over the coming years. However, we note that renewable and nuclear power generation face various logistical and economic limitations, while natural gas power generation is relatively flexible and easier to deploy. We expect natural gas to account for an increasing share of domestic power generation over the coming years, up from around 43% today, which is further supported by our expectation for continued coal-to-gas switching in the power-generation mix over the coming years.
Chart 2. U.S. power-generation mix led by natural gas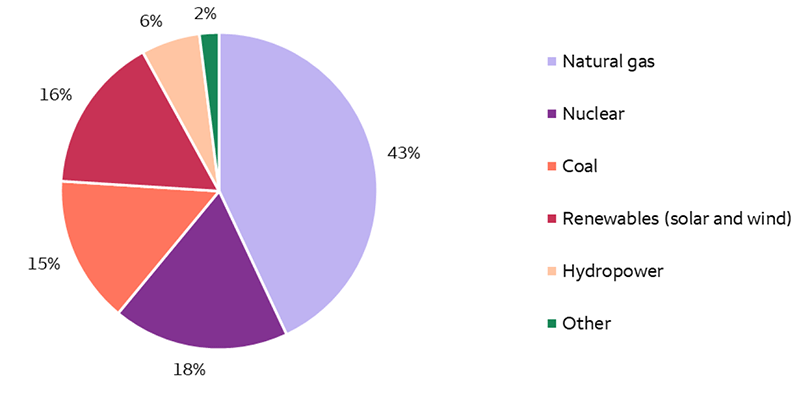
Source: EIA. Data as of 2024.
Investment implications
The U.S. has ample supply of natural gas to meet this growing demand as it is the world’s largest producer of natural gas, accounting for over 25% of global production with approximately 80 years of recoverable reserves at current production levels.3 The acceleration of demand growth represents a structural shift, and we believe that natural gas producers are generally in a good position to meet this demand growth with increased supply. However, the timing of supply growth will be a key variable, which may result in periods of imbalances between supply and demand. As a result, we see the potential for increased volatility and modestly higher natural gas prices on average over the coming years.
We view infrastructure as the missing link to bridge supply and demand growth in this environment, which is critical to our favorable view of the Midstream Energy sub-sector. We expect midstream energy companies focused on natural gas to benefit from a fairly steady runway of incremental growth opportunities as well as higher utilization and an extended useful life for existing assets. In this environment, a number of midstream energy companies have reported improved fundamental growth outlooks and expanding project backlogs with attractive returns.
4
1 According to the U.S. Energy Information Administration (EIA) and Wells Fargo Securities.
2 Hyperscalers refers to hyperscale cloud providers, a small group of companies who operate large networks of large data centers to facilitate cloud computing.
3 According to the EIA.
4 According to various Midstream Energy financial statements, earnings guidance, and Wells Fargo Securities.
AI market transitioning from training to inference
Since the start of the year, a few topics have sparked a heated investor debate about AI data-center investments peaking at some point. These have included news that China developed a competitive reasoning model more efficiently at a fraction of the cost of the best reasoning models released by the U.S., along with broader macro uncertainty related to tariffs imposed by the Trump administration. While investors’ worries over AI data-center capital expenditure (capex) growth will take time to figure out, we expect ongoing domestic hyperscale capex spending, incremental sovereign AI demand, and enterprise adoption of AI will help bolster AI demand in 2025.
Over the past few years, a considerable portion of generative AI’s initial infrastructure buildout phase has been driven by the need to train cutting-edge large language models and now by complex reasoning models released by U.S. hyperscale companies. The costs associated with developing, training, and managing chain-of-thought reasoning models are prohibitive as these models are very compute, semiconductor, and networking intensive.
We believe China’s technical breakthrough in overall model training and inference efficiency will result in lower inference costs and help accelerate the transition from capex spending on training to inference. While absolute U.S. hyperscale capex investments remain high this year at $312 billion, we believe lower inference costs will eventually lead to new use cases, a broader lift in overall AI demand, higher computing requirements, and a shift in hyperscale capex spending tilted more toward inferencing versus training earlier than we expected.
Forecasts for training versus inference revenues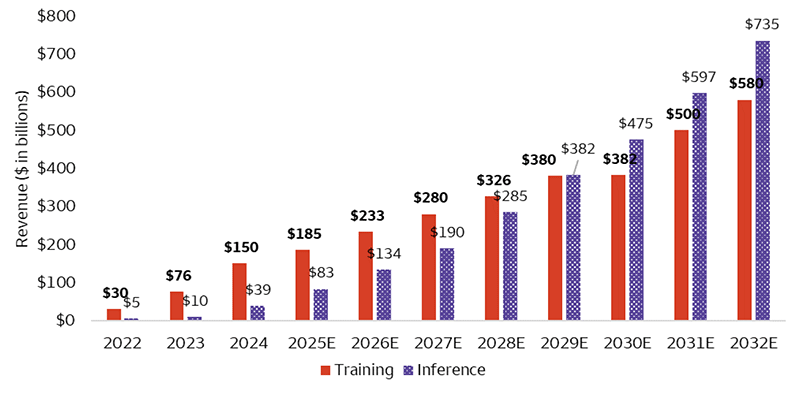
Sources: Wells Fargo Investment Institute, Bloomberg, and International Data Corporation (IDC). Data as of March 24, 2025. E = estimated. Estimates based on Bloomberg Intelligence forecasts using IDC data.
Forecasts are not guaranteed and based on certain assumptions and on views of market and economic conditions which are subject to change.
Muni tax exemption untouched in tax bill, for now
On May 22, the U.S. House of Representatives passed a wide-sweeping tax and spending bill in part as a response to the expected extension of the 2017 Tax Cuts and Jobs Act, originally set to expire in 2025. The vote in the House successfully passed the legislation by the narrowest of margins, 215 votes to 214 votes. The legislation, also referred to as “The One, Big, Beautiful Bill,” makes no mention of any changes to the current tax-exempt nature of municipal bonds, either those issued for traditional municipal borrowers or those issued for qualified private-activity bonds.
Municipal market stakeholders were anxiously awaiting the bill since January, when it was determined that municipal tax exemption was one of numerous items on the table for cost-cutting consideration. We attribute the lack of action with respect to the revocation of the municipal tax exemption to the significant amount of lobbying and education on the importance of the municipal-bond tax exemption for both investors as well as public infrastructure funding over the past three to four months.
We consider the absence of discussion on municipal-bond tax exemption in the bill to be good news for municipal investors. However, the process is not yet complete, and there is certainly potential for change as it moves to the Senate for consideration. Although the chance of revocation of the municipal tax exemption is not zero, we continue to maintain our belief that the status quo will ultimately be maintained for state and local government borrowers. However, we continue to acknowledge there is more risk to the exemption for private-activity bonds should any changes be made in the finalization of the legislation. Wells Fargo Investment Institute (WFII) currently has a favorable view on the U.S. Municipal Bond sector.
How to develop a diversified alternative allocation
Among the variety of alternative investments available across private-capital and hedge-fund strategies, many offer a differentiated return-and-risk profile or focus on specialized investment opportunities. Therefore, we believe it is prudent for qualified investors to consider a diversified alternative allocation to complement their traditional equity and fixed-income investments.
We believe qualified investors should first consider their investment objectives, such as their preference for long-term capital appreciation or desire for regular investment income. WFII’s illiquid strategic asset allocation, which allocates between 20% and 30% to alternative investments, provides a useful reference (chart below). For income objectives, the strategic allocation emphasizes yield-oriented asset classes, including both Private Debt and Private Real Estate. Additionally, hedge-fund strategies may have the potential to benefit income portfolios with their low correlation to public markets. In both Growth & Income and Growth objectives, Private Equity is introduced in strategic allocations given its potential to offer long-term returns.
We believe it is also often prudent to further diversify among alternative investment strategies given the market backdrop. For example, in the current environment we prefer to diversify income sources across multiple Private Real Estate property sectors and Private Infrastructure to leverage long-term demographic and digitization trends, while also reducing a portfolio’s sensitivity to inflation. Within Private Equity, investors may consider allocating across Large Cap Buyout, Small/Mid Cap Buyout, Growth Equity, and Venture Capital sub-strategies to invest in the landscape of private companies in various life stages that balance appreciation potential with different levels of risk.
We believe a diversified alternative allocation can complement a portfolio of traditional equities and fixed-income investments and potentially enhance a portfolio’s long-term return while reducing volatility over time.
WFII’s illiquid strategic asset allocation allocates 20% – 30% to alternative investments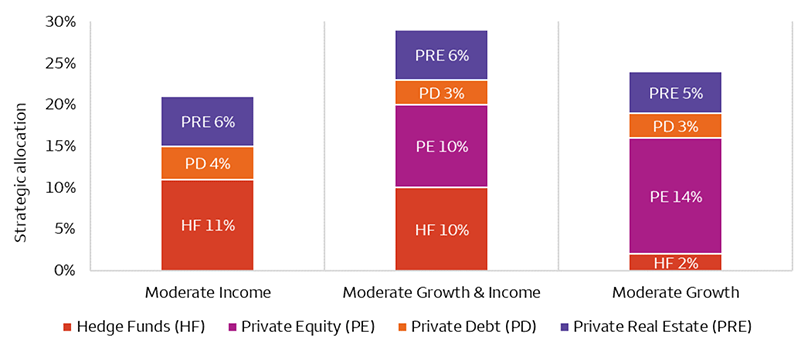
Source: Wells Fargo Investment Institute. Strategic asset allocation as of May 31, 2025.
Alternative investments, such as hedge funds, private equity, private debt and private real estate funds are not appropriate for all investors and are only open to “accredited” or “qualified” investors within the meaning of U.S. securities laws.
Cash Alternatives and Fixed Income
| Most Unfavorable |
Unfavorable |
Neutral |
Favorable |
Most Favorable |
|
intentionally blank
|
- U.S. Long Term Taxable Fixed Income
- U.S. Short Term Taxable Fixed Income
|
- Cash Alternatives
- Developed Market Ex-U.S. Fixed Income
- Emerging Market Fixed Income
- High Yield Taxable Fixed Income
- U.S. Intermediate Term Taxable Fixed Income
|
intentionally blank
|
intentionally blank
|
Equities
| Most Unfavorable |
Unfavorable |
Neutral |
Favorable |
Most Favorable |
|
intentionally blank
|
|
- Developed Market Ex-U.S. Equities
- U.S. Small Cap Equities
|
- U.S. Large Cap Equities
- U.S. Mid Cap Equities
|
intentionally blank
|
Real Assets
| Most Unfavorable |
Unfavorable |
Neutral |
Favorable |
Most Favorable |
|
intentionally blank
|
intentionally blank
|
|
|
intentionally blank
|
Alternative Investments**
| Most Unfavorable |
Unfavorable |
Neutral |
Favorable |
Most Favorable |
|
intentionally blank
|
intentionally blank
|
- Hedge Funds—Equity Hedge
- Hedge Funds—Relative Value
- Private Equity
- Private Debt
|
- Hedge Funds—Event Driven
- Hedge Funds—Macro
|
intentionally blank
|
Source: Wells Fargo Investment Institute, June 2, 2025.
*Tactical horizon is 6-18 months
**Alternative investments are not appropriate for all investors. They are speculative and involve a high degree of risk that is appropriate only for those investors who have the financial sophistication and expertise to evaluate the merits and risks of an investment in a fund and for which the fund does not represent a complete investment program. Please see end of report for important definitions and disclosures.