Focus on trends, not the tremors
Policy changes from Washington have been frequent and sometimes abrupt this year. Tariff policy arguably heads that list of changes, but immigration and fiscal policy also matter to markets. In this report, we consider that policy can have an impact on the economy, but that headlines around policy impacts are not always more important than other factors. Headlines can surprise markets, but the effect may be fleeting if the balance of fundamental factors is more substantially positive.
A tariff is effectively a tax on final buyers, and a tax can raise price and may weigh on profit margins. We are seeing these impacts flow through into producer and consumer prices, as well as margin pressure in some industries. But we also see other factors that mitigate the impacts, including the legal challenge to universal and country-specific reciprocal tariffs. The Trump administration has invoked the International Emergency Economic Powers Act (IEEPA — see sidebar) to impose a series of tariffs across countries, a move that has prompted legal challenges. In August 2025, a federal appeals court ruled that the IEEPA does not authorize imposition of broad tariffs, upholding a lower court’s decree from May 28.
The U.S. Supreme Court is set to hear arguments on November 5, and a ruling could be issued before year end. For now, the tariffs continue and uncertainty about potential new tariffs on China persists, but we believe the court case illustrates one way in which the mitigating factors slow down and spread out the tariff impacts until other factors, such as fiscal-policy stimulus, command a more important place in the investment outlook.
A stash of trade statutes and refund mechanisms
If the Supreme Court rules that the IEEPA does not grant President Trump the authority to impose tariffs, he could turn to statutes that grant presidential authority to levy tariffs by product sector or country.
- Section 122 of the Trade Act of 1974 gives the president temporary authority to impose an import surcharge of up to 15% for 150 days to address significant balance of payments deficits. This statute requires an act of Congress to extend the measures.
- Section 232 of the Trade Expansion Act of 1962 allows the president to restrict imports deemed a threat to U.S. security. President Trump has imposed section 232 tariffs on specific products with proposals pending.
- Section 301 of the Trade Act of 1974 empowers the Office of the U.S. Trade Representative to retaliate against foreign-trade practices deemed discriminatory to U.S. commerce. Section 301 allows the administration to impose a special levy rate on China in response to Beijing’s tightened export control of rare-earth metals.
If the administration fails in its appeal, it could be compelled to reimburse tariff revenue, an outcome supported by precedent. Although the figure is provisional, Strategas Research Partners estimates (as of October 3) that $200 billion in tariff revenue could be subject to refunds. The Supreme Court may impose a cap or authorize the administration to pursue alternative methods of compensating importers, helping mitigate a substantial federal expenditure. In our view, the most likely outcome is that the administration will credit reimbursements against future duties owed to the U.S. under a replacement tariff scheme.
Fiscal-policy clarity may be overlooked
The legal challenge is but one factor that could delay and diffuse tariff impacts. A more constructive outlook for markets may stem from fiscal-policy measures already in place. The One Big Beautiful Bill Act provides favorable accounting treatments — sizeable increases in equipment expensing, coupled with higher and retroactive deductions for research and development (R&D) and interest costs, that may offset profit erosion of tariffs. Lost in the incessant stream of sound bites of tax-cut extensions and programmatic spending cuts is that companies may benefit from improved margins and earnings. The tax changes include consumer provisions — an expanded Child Tax Credit, higher standard income deduction tax limits, and increases in the State and Local Tax (SALT) deduction. The new fiscal clarity offered to businesses and consumers appears to have bolstered market enthusiasm.
The Infrastructure Investment and Jobs Act of 2021, which funds renovation of U.S. infrastructure, has allocated just 50% of the $1.2 trillion allocated to date. The CHIPS and Science Act of 2022 to support U.S. technology innovation and chip manufacturing, has also yet to be fully allocated as the push to strengthen onshore supply chains remains a top priority for both political parties. Additionally, deregulation — largely in Energy, Financials, and Health Care — should help reduce overhead.
Economic and market implications
Tariffs do have consequences, and new tariff announcements, such as those recently threatened by the U.S. and China against each other, can still surprise financial markets. But we expect that the staggered rollouts and legal challenge will delay and water down the tariff-induced inflation and moderation in economic activity that we expect over the coming six months. While consumer prices will likely rise, the full impact of Section 232 or 301 levies may take months to materialize.
Meanwhile, our work suggests other factors we think will more than counterbalance tariff impacts. Large tax refunds next year are one. Also, companies have had an opportunity for the past six months to find suppliers outside of China. In fact, U.S. imports in aggregate have already shifted significantly away from China to elsewhere in Asia. Other positive trends already in place include deregulation, falling short-term interest rates, and spending on technology. We are inclined to look through tariff headlines to focus on the factors already in place. We consider the investment implications of this and other conclusions in the third section of this report.
-
The International Emergency Economic Powers Act (IEEPA) is a 1977 law granting the U.S. president broad authority to regulate economic transactions following a national emergency.
-
As of March 1, 2025, the U.S. government has collected $94 billion in tariffs.
-
Source: Strategas, September 27, 2025.
Immigration’s impact on the labor market
Tighter immigration controls have been another 2025 policy pillar, and the strict border control, rather than highly visible deportations, accounted for most of the decline in unauthorized immigrants during the first seven months of this year.1 Immigration controls make it more difficult to count undocumented workers in the labor force and complicates the monthly task of estimating the number of new jobs created. Yet, looking through that uncertainty, the full picture on employment and wages suggests a still-stable labor market.
Why immigration matters for the U.S. labor market and monetary policy
In recent years, foreign-born workers have helped fill a gap left by the large number of retirees in an aging U.S. workforce with 12-month growth of 2.4% more than double the 0.9% annual rise in the native-born workforce.2 Stricter border controls introduce some uncertainties around measuring labor-market health because unauthorized workers may be reluctant to respond to government surveys about their working status.
The challenge of counting undocumented workers may be obscuring the link between the labor market and the economy at a time when the Federal Reserve (Fed) has become more sensitive to a softening labor market. After all, if the number of new jobs declines sharply from previous years’ averages, the question for policymakers is whether the number of new jobs has fallen or whether there are simply fewer job applicants. The Federal Reserve Bank of Dallas estimates that the break-even employment rate — or the number of monthly job gains needed to maintain a stable unemployment rate — has fallen to roughly 30,000 as of mid-2025 from a peak of 250,000 in 2023 because of slower growth in the labor supply.3
A moderating but still-stable labor market
As with tariffs, the ultimate impact of restricting immigration remains to be seen. However, we see clear signs that the issue is more the shortage of workers than a shortage of jobs. We note, for example, that reluctance to discharge workers has been apparent from the Labor Department’s recent data on monthly hiring and layoffs. A related statistic is the lack of a sustained rise in the weekly initial unemployment insurance claims. As Chart 1 shows, limited increases in the unemployment rate, due to tight labor supply, have left it at a historically low level despite slowing job growth. What’s more, the gap between hiring and layoffs, unusually wide in the wake of the pandemic, is only now dipping below its narrower pre-pandemic norm. Finally, real (inflation-adjusted) wage growth has recently moderated but is still nearly a percentage point above the prevailing consumer price inflation rate. If the labor market were heading for recession, we would expect wage gains to evaporate. As we detailed in the previous section, policy matters, but so do other factors. Ultimately, we believe markets focus more on fundamental factors affecting supply and demand than, what at times can become mostly noise that is secondary to investment decision- making.
Chart 1. Still a historically low jobless rate despite slowing employment gains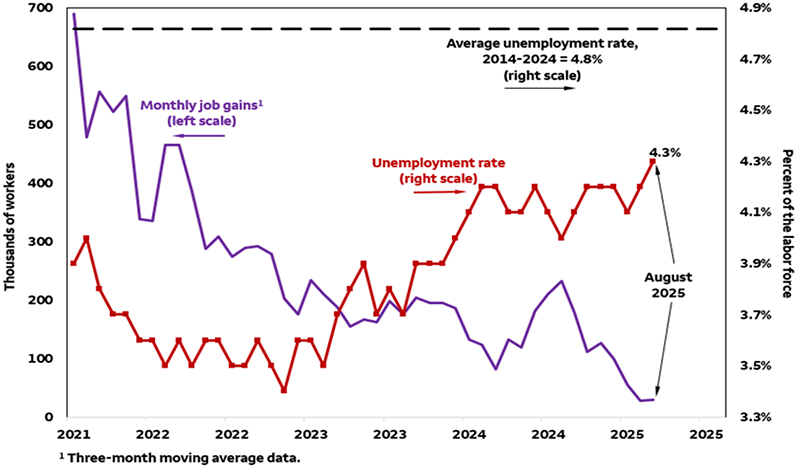
Sources: U.S. Labor Department and Wells Fargo Investment Institute. Data as of September 5, 2025.
Investment implications
Immigration-related impacts on labor-data add uncertainties for investors, but we believe today’s labor market features important strengths that will support economic and earnings growth through 2026. Lower short-term borrowing costs converge with deregulation, tax cuts, and tech spending. These trends are already in place and, with tight labor supply, are starting to produce productivity gains. Workers who can produce more per hour at a given cost can restrain price inflation and boost profit margins and wages. We consider the investment implications at the end of the next section.
-
Foreign-born workers accounted for nearly 20% of the U.S. workforce in August 2025, up from 16.7% a decade ago.
-
Source: U.S. Labor Department, “The Employment Situation,” September 5, 2025.
-
One estimate for the breakeven employment rate — or the number of monthly job gains needed to maintain a stable unemployment rate — has fallen to roughly 30,000 as of mid-2025 from a peak of approximately 250,000 in 2023.
-
Source: Anton Cheremukhin, Federal Reserve Bank of Dallas, “Break-Even Employment Declined After Immigration Changes,” October 9, 2025.
1 Pew Research Center estimates a 1.2 million decline in unauthorized immigrants during the first seven months of 2025 from a peak of 14 million in 2023. See Jeffrey S. Passel, Jens Manuel Krogstad, “U.S. Unauthorized Immigrant Population Reached a Record 14 million in 2023,” Pew Research Center, August 21, 2025.
2 U.S. Labor Department, “The Employment Situation,” September 5, 2025.
3 Anton Cheremukhin, Federal Reserve Bank of Dallas, “Break-Even Employment Declined After Immigration Changes,” October 9, 2025.
Viewing the U.S. dollar in a global context
One of the most prominent investor concerns we have heard this year has been the potential impact of rising U.S. government deficits and debt on the U.S. dollar. When debt is viewed as a percent of the economy’s size as measured by GDP, the we view the U.S. as better off than a number of other developed country’s economies. Clearly, government debt concerns are not unique to the U.S. government — in many European countries government spending is 40% - 50% of the economy.4 Budget surpluses are rare. Emerging economies have followed the trend. China’s government spending as a share of the economy has surged almost three-fold from 1995 - 2023.
Negative headlines about the U.S. dollar hide weakness overseas and strength at home, in our opinion.
Headlines early in 2025 worried about the U.S. dollar’s sharp fall earlier in 2025 after a selloff in U.S. technology-related equities. Foreign investors had poured a record amount of capital into U.S. equity markets late in 2024 (36.28% government expenditure as % of GDP),5 and many sharply withdrew funds after China’s Deep Seek announcement in January 2025.
The U.S. dollar’s exchange value stabilized later in 2025 as U.S. equity markets rebounded and issues with European and Japanese government deficits arose. Those deficit concerns have continued as a French government was in power less than a month because of a budget impasse, while Japan’s new prime minister leads a party that has favored deficit spending. The chart below shows rising risks in French versus German sovereign debt (the latter of which issues higher-quality developed-market bonds) amid volatility in the French government, reaching the highest levels in 10 years.
Chart 2. Widening yield spreads in French and German bonds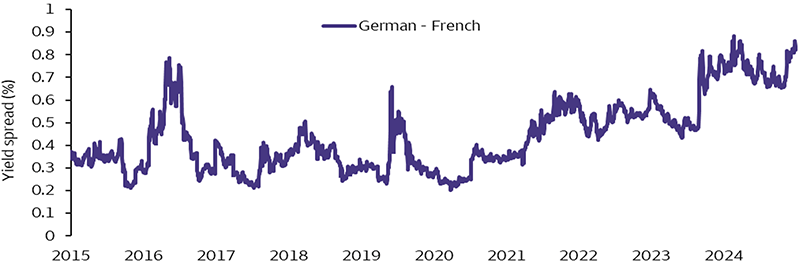
Sources: Bloomberg and Wells Fargo Investment Institute as of 10/13/2025. Data of the last 10 years beginning 10/14/2015. Spread is defined as the difference between French and German 10-year government bond yields. A higher number would indicate more yield in French bonds vs German. Current yields may be higher or lower than those used in this illustration.
Past performance is not a guarantee of future results.
We believe the U.S. economy and financial markets support the U.S. dollar’s role as the world’s premier currency. The U.S. leads in corporate and scientific innovation. Further, we view U.S. debt as the backbone of global credit markets. The size of the U.S. government securities market is more than three times that of the next largest G76 country, Japan. With this capacity, U.S. Treasuries are also tremendously liquid. U.S. debt maintains a high credit quality and is backed by the taxing power of the U.S. government. We see these strengths as sustainable.
Investment implications
In closing, headlines sometimes herald fundamental changes that have lasting market impacts. But there are headlines every day while fundamentals typically change less often, so we favor always weighing headlines carefully to see if portfolio decisions are warranted. We see negative economic impacts from tariffs, limited immigration and the U.S. dollar’s weakness earlier this year, but this report has described how other circumstances mitigate the impacts. Meanwhile, the headlines around these impacts miss larger and more important positive fundamental trends that we see as more durable and already in place. Those include:
- Tax cuts that we expect will deliver the largest corporate and individual refunds since the 2021 pandemic year
- Deregulation and productivity gains, which should raise profit margins and wages and restrain inflation
- Lower borrowing costs that support economic growth, especially among small businesses
- A likely strong, multiyear trend in business technology-related spending
Our investment guidance looks selectively for possible opportunities from these trends. In equities, the tax cuts and tech spending favor U.S. Large- and U.S. Mid-Cap Equities over international and U.S. Small-Cap Equities. Among U.S. equity sectors, we favor Information Technology, as well as the Industrials and Utilities sectors that we think benefit from the buildout of data centers for artificial intelligence. We also hold a most favorable view toward Financials, which could benefit from business expansion and particularly a wider spread between short- and long-term interest rates.
In fixed income, our selectivity favors investment-grade corporate and municipal debt at intermediate maturities (e.g., three to seven years for taxable and slightly longer for municipals). Longer-term yields may vary as tariff and deficit impacts are more visible and short-term yields fall with Fed interest-rate cuts. Government shutdown and reduced federal Medicaid support could negatively impact municipal valuations, and we favor investment-grade general-obligation and revenue municipal debt.
Some investors may want to hedge domestic and international political risk or look for value as short-term interest rates decline. We see Commodities as a good hedge in this environment and prefer a full portfolio allocation, while favoring precious and base metals.
-
The U.S. is the largest issuer of long-term government securities, many times the next largest issuer. Government debt securities themselves are almost the size of the public and private securities of the rest of the G7 combined.
-
Source: Bank for International Settlements, as of Q1 2025.
-
Of the 10 largest economies in the world, none ran a budget surplus in 2024.
-
Source: IMF. 10 largest economies as defined by gross domestic product (GDP).
4 “Government Spending: What Do Governments Spend Their Financial Resources On?” Our World In Data, April 2025.
5 International Monetary Fund as of 2023.
6 The Group of 7 (G7) consists of the finance ministers and central bank governors of the seven major advanced economies according to the International Monetary Fund.