Investment decisions driven by emotions may lead to lower returns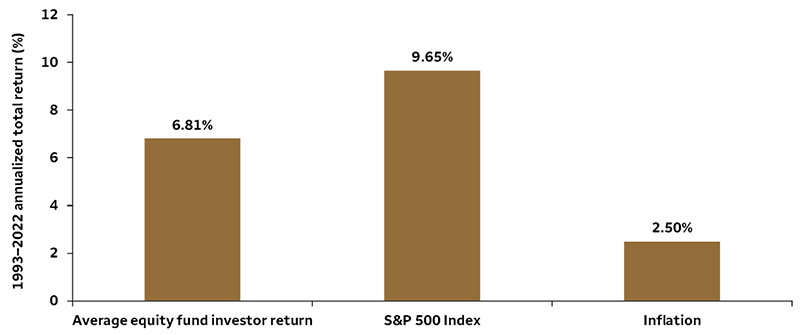
Source: DALBAR, Inc., “Quantitative Analysis of Investor Behavior,” 2025. Chart shows 30 years from 1995 – 2024. For illustrative purposes only. Dalbar computed the average stock fund investor return by using industry cash flow reports from the Investment Company Institute. The Average Equity Fund Investor is comprised of a universe of both domestic and world equity mutual funds. It includes growth, sector, alternative strategy, value, blend, emerging markets, global equity, international equity, and regional equity funds. Returns assume reinvestment of dividends and capital gain distributions.
The performance shown is for illustrative purposes only, and not indicative of any particular investment. An index is unmanaged and not available for direct investment. Past performance is not a guarantee of future results. Inflation is represented by the Consumer Price Index.
Our research suggests that missing a handful of the best days over longer time periods drastically reduces the average annual return an investor could gain by simply holding on to their equity investments during market sell-offs. Over the past 30 years, missing the best 30 days (based on S&P 500 Index returns from July 1, 1995, through June 30, 2025) took the annual average return from 8.4% per year down to 2.1%, which was less than the 2.5% average inflation rate over that same period. Our research also showed that over the same time period, missing the best 40 days took the average annual return nearly flat to 0.7%, and missing the best 50 days resulted in a -0.6% annual return, on average. Based on this study, equities accumulated most of their gains over just a few trading days.
Missing the market’s best days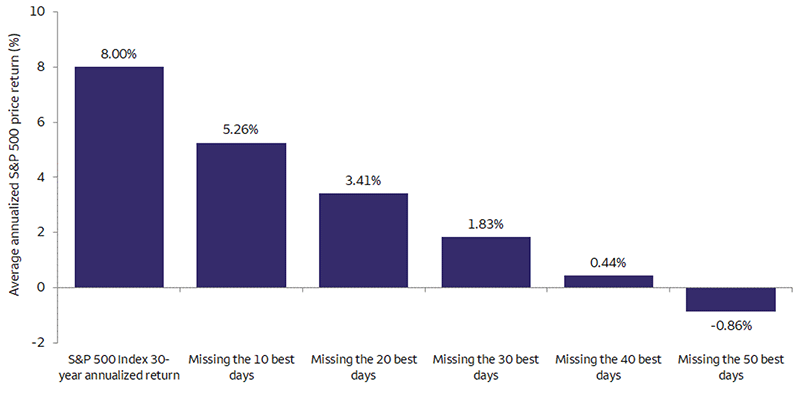
Sources: Bloomberg and Wells Fargo Investment Institute. Daily data: July 1, 1995 – June 30, 2025, for the S&P 500 Index. Best days are calculated using daily returns. For illustrative purposes only. An index is unmanaged and not available for direct investment.
A price index is not a total return index and does not include the reinvestment of dividends. Past performance is no guarantee of future results.
What if an investor could somehow remain invested in the markets during the best days, but avoid the worst days? That would be the best of circumstances — and would result in far higher returns over the course of the holding period. But is that possible?
Our analysis shows that historically the best days in the S&P 500 Index tend to cluster in the midst of a bear market or recession, when the market is at its most volatile. Additionally, some of the worst days have occurred during bull markets. Of the 10 best trading days in terms of percentage gains, nine took place during recessions and six also coincided with a bear market, with three of those in the 2020 recession and the remaining days during the Great Recession of 2007 – 2009. Only one of the best trading days over the past 30 years (April 9, 2025) occurred during a bull-market correction. History suggests that disentangling the best and worst days can be quite difficult because they have often occurred in a very tight time frame, sometimes even on consecutive trading days. In our view, these findings argue strongly for most investors to remain invested in the equity markets, even during periods of high volatility.
Market performance — The best days and worst days have often occurred close together 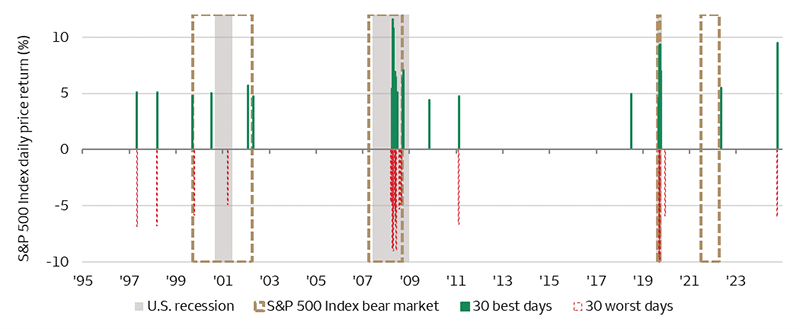
Sources: Bloomberg and Wells Fargo Investment Institute. Daily data: July 1, 1995 – June 30, 2025, for the S&P 500 Index. Best and worst days are calculated using daily returns. For illustrative purposes only.
A price index is not a total return index and does not include the reinvestment of dividends. There are difficulties assessing index performance during certain correction periods, in part, because index results do not represent actual trading and cannot completely account for the impact financial risk has on actual trading. An index is unmanaged and not available for direct investment.
Past performance is no guarantee of future results.
Not only have the best and worst days typically clustered together, but they also often occurred during bear markets or recessions. For example, three of the 30 best days and five of the 30 worst days occurred during the eight trading days between March 9 and March 18, 2020. Another historical study we conducted shows that missing both the best and the worst trading days during various time periods can result in somewhat higher equity returns than those of a traditional buy-and-hold strategy (see chart below). Although the difference may not be enough to account for trading and tax costs, it is interesting to note that, based on the historical returns in the chart, reducing equity exposure during periods with significant market volatility improved returns (based on S&P 500 Index returns from July 1, 1995, through June 30, 2025).
Missing the best and worst days — Reduced exposure during market volatility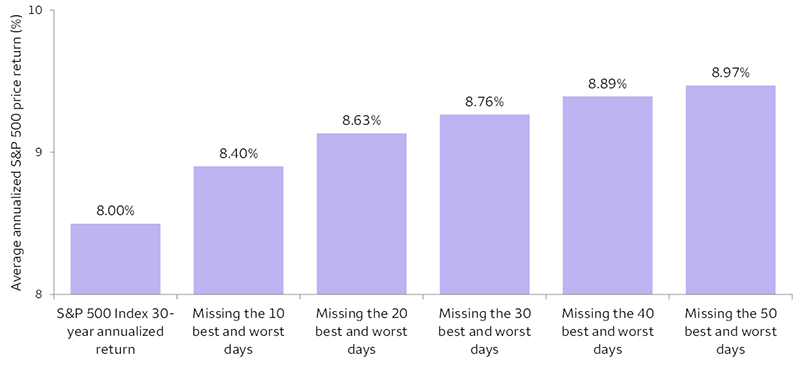
Sources: Bloomberg and Wells Fargo Investment Institute. Daily data: July 1, 1995 – June 30, 2025, for the S&P 500 Index. Best and worst days are calculated using daily returns. For illustrative purposes only. An index is unmanaged and not available for direct investment.
A price index is not a total return index and does not include the reinvestment of dividends. Past performance is no guarantee of future results.
While market volatility has come down from heightened levels in the first quarter of 2025, several economic, geopolitical, and market uncertainties remain that may contribute to continued elevated volatility throughout the year. Even as the stock market has reached new highs, it continues to grapple with the potential for an economic slowdown, the timing and amount of rate cuts by the Federal Reserve in 2025 and 2026, and the lingering impacts of still-elevated inflation and interest rates. As risks remain, we suggest focusing on quality at the asset-class level. We currently prefer U.S. Large Cap and Mid Cap Equities over U.S. Small Cap Equities, and we prefer Developed Market ex-U.S. Equities over Emerging Market Equities. In fixed income, we prefer securities with higher credit quality over high-yield debt. We are neutral on Duration (a measure of interest rate sensitivity), and we favor U.S. Intermediate Term Taxable Fixed Income over U.S. Short or Long Term Taxable Fixed Income. During times of heightened volatility, we encourage investors to review portfolio allocations and strategies. When opportunities arise, we typically use our tactical asset allocation strategy (increasing or decreasing exposure to asset classes over shorter time periods) in an effort to improve potential returns while decreasing potential volatility risk.
- In 2024, the average equity fund investor underperformed the S&P 500 Index by 8.48% (25.02% for S&P 500 Index versus 16.54% for average equity fund investor).1
- The return gap of 8.48% in 2024 was the second largest annual investor gap in the past 10 years. Only 2021 saw a wider disparity, when the investor gap reached 10.32%.
Since 1994, DALBAR's Quantitative Analysis of Investor Behavior (QAIB) has measured the effects of investor decisions to buy, sell, and switch into and out of mutual funds over short-term and long-term time frames. These effects are measured from the perspective of the investor and do not represent the performance of the investments themselves. The results consistently showed that the average investor earned less — in many cases, much less — than mutual fund performance reports would suggest.2
With an investor gap of 8.48%, 2024 marked another year where robust market performance did not translate to equally robust gains for investors. This illustrates the cost of behavior-driven decision making compared to a buy-and-hold strategy. DALBAR has analyzed investors’ market timing successes and failures through net purchases and sales of funds since 1994. This form of analysis, known as the Guess Right Ratio, examines fund inflows and outflows as a potential means of determining how often investors correctly anticipate the direction of the market the following month. Investors tend to “guess right” when a net inflow is followed by a market gain or when a net outflow is followed by a decline.
Based on DALBAR findings, investors have guessed right at least half of the time in 12 out of the past 21 years. In contrast, in 2024, investors guessed correctly in only one quarter. Unfortunately, according to the QAIB, guessing right has not produced superior gains for the average investor because the dollar volume of bad guesses exceeded the dollar volume of correct guesses. Even one month of wrong guesses can potentially wipe out the gains from several months of correct ones.
DALBAR also analyzes retention rates that measure cash outflows in proportion to assets to arrive at the length of time the average investor holds a fund if the current redemption rate persists. Historically, retention rates increase when the market is rising and contract during market downturns. In 2024, despite an up market, retention rates fell 55 days to 4.79 years. This came in stark contrast to the increase in retention rates from 4.25 years in 2022 to 4.94 in 2023.
1 Average equity fund investor: The average equity fund investor is comprised of a universe of both domestic and world equity mutual funds. It includes growth, sector, alternative strategy, value, blend, emerging markets, global equity, international equity, and regional equity funds.
2 2025 DALBAR QIAB Report.


 Source: DALBAR, Inc., “Quantitative Analysis of Investor Behavior,” 2025. Chart shows 30 years from 1995 – 2024. For illustrative purposes only. Dalbar computed the average stock fund investor return by using industry cash flow reports from the Investment Company Institute. The Average Equity Fund Investor is comprised of a universe of both domestic and world equity mutual funds. It includes growth, sector, alternative strategy, value, blend, emerging markets, global equity, international equity, and regional equity funds. Returns assume reinvestment of dividends and capital gain distributions. The performance shown is for illustrative purposes only, and not indicative of any particular investment. An index is unmanaged and not available for direct investment. Past performance is not a guarantee of future results. Inflation is represented by the Consumer Price Index.
 Sources: Bloomberg and Wells Fargo Investment Institute. Daily data: July 1, 1995 – June 30, 2025, for the S&P 500 Index. Best days are calculated using daily returns. For illustrative purposes only. An index is unmanaged and not available for direct investment. A price index is not a total return index and does not include the reinvestment of dividends. Past performance is no guarantee of future results.
 Sources: Bloomberg and Wells Fargo Investment Institute. Daily data: July 1, 1995 – June 30, 2025, for the S&P 500 Index. Best and worst days are calculated using daily returns. For illustrative purposes only. A price index is not a total return index and does not include the reinvestment of dividends. There are difficulties assessing index performance during certain correction periods, in part, because index results do not represent actual trading and cannot completely account for the impact financial risk has on actual trading. An index is unmanaged and not available for direct investment. Past performance is no guarantee of future results.
 Sources: Bloomberg and Wells Fargo Investment Institute. Daily data: July 1, 1995 – June 30, 2025, for the S&P 500 Index. Best and worst days are calculated using daily returns. For illustrative purposes only. An index is unmanaged and not available for direct investment. A price index is not a total return index and does not include the reinvestment of dividends. Past performance is no guarantee of future results.