August 12, 2025
Global Asset Allocation Strategy Team
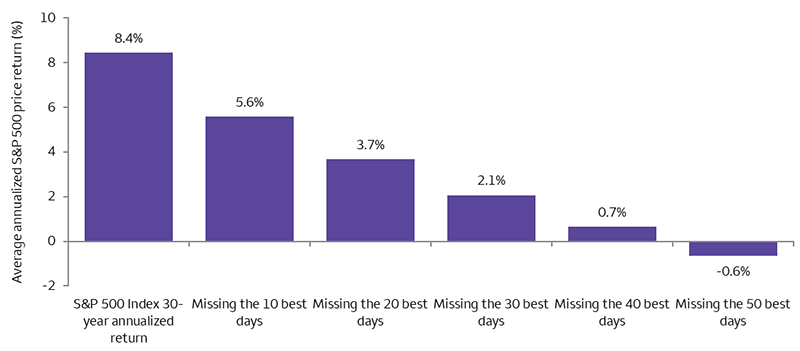
Missing the market’s best days
 Sources: Bloomberg and Wells Fargo Investment Institute. Daily data: July 1, 1995 – June 30, 2025, for the S&P 500 Index. Best days are calculated using daily returns. For illustrative purposes only. An index is unmanaged and not available for direct investment. A price index is not a total return index and does not include the reinvestment of dividends. Past performance is no guarantee of future results. Excerpted from Special Report, “The perils of trying to time volatile markets” (July 28)
Market timing is difficult, and missing the best days can weigh heavily on long-term returns
Volatility has resurged recently as markets continue to grapple with evolving trade policy, the potential for an economic slowdown, the timing and amount of Federal Reserve rate cuts, and the lingering impacts of still-elevated inflation and interest rates. As uncertainty rises, investors may find themselves considering selling into volatile markets.
However, as shown in the chart above, our research suggests that missing a handful of the best days over longer time periods drastically reduces the average annual return an investor could gain by simply holding on to their equity investments during market sell-offs. Based on this study, equities accumulated most of their gains over just a few trading days, and the best and worst trading days have historically often occurred in a very tight time frame.
What it may mean for investors
We believe that staying fully invested in equity markets over a full market cycle is more beneficial than selling into volatile markets and attempting to avoid the worst-performing days. We also suggest rebalancing — buying asset classes that have fallen below a portfolio’s long-term allocations and selling those that are higher than long-term allocations — during periods of market volatility.
Risk Considerations
Each asset class has its own risk and return characteristics. The level of risk associated with a particular investment or asset class generally correlates with the level of return the investment or asset class might achieve. Stock markets, especially foreign markets, are volatile. Stock values may fluctuate in response to general economic and market conditions, the prospects of individual companies, and industry sectors.
Definitions
S&P 500 Index is a market capitalization-weighted index composed of 500 widely held common stocks that is generally considered representative of the US stock market.
An index is unmanaged and not available for direct investment.
General Disclosures
Global Investment Strategy (GIS) is a division of Wells Fargo Investment Institute, Inc. (WFII). WFII is a registered investment adviser and wholly owned subsidiary of Wells Fargo Bank, N.A., a bank affiliate of Wells Fargo & Company.
The information in this report was prepared by Global Investment Strategy. Opinions represent GIS’ opinion as of the date of this report and are for general information purposes only and are not intended to predict or guarantee the future performance of any individual security, market sector or the markets generally. GIS does not undertake to advise you of any change in its opinions or the information contained in this report. Wells Fargo & Company affiliates may issue reports or have opinions that are inconsistent with, and reach different conclusions from, this report.
The information contained herein constitutes general information and is not directed to, designed for, or individually tailored to, any particular investor or potential investor. This report is not intended to be a client-specific suitability or best interest analysis or recommendation, an offer to participate in any investment, or a recommendation to buy, hold or sell securities. Do not use this report as the sole basis for investment decisions. Do not select an asset class or investment product based on performance alone. Consider all relevant information, including your existing portfolio, investment objectives, risk tolerance, liquidity needs and investment time horizon. The material contained herein has been prepared from sources and data we believe to be reliable but we make no guarantee to its accuracy or completeness.
Wells Fargo Advisors is registered with the U.S. Securities and Exchange Commission and the Financial Industry Regulatory Authority, but is not licensed or registered with any financial services regulatory authority outside of the U.S. Non-U.S. residents who maintain U.S.-based financial services account(s) with Wells Fargo Advisors may not be afforded certain protections conferred by legislation and regulations in their country of residence in respect of any investments, investment transactions or communications made with Wells Fargo Advisors.
Wells Fargo Advisors is a trade name used by Wells Fargo Clearing Services, LLC and Wells Fargo Advisors Financial Network, LLC, Members SIPC, separate registered broker-dealers and non-bank affiliates of Wells Fargo & Company.


