High yield is changing: Why today’s market looks stronger than the past
Concerns about credit risk have increased in recent months, fueled by headlines around losses in areas of private credit and leveraged loans. It is easy to assume that trouble in the other segments of the debt market could spill over into public high yield bonds, but we believe today’s high yield market looks different from past cycles.
A higher quality high yield market
High yield bonds have long carried the nickname “junk” bonds — a label rooted in the market’s history of weak balance sheets and higher default risk. But we believe that description overlooks how the high yield universe has evolved over the last decade.
Borrowers today have financing options beyond the public bond market. The growth of private credit, especially direct lending, has provided alternative funding sources, particularly for small private companies. As a result, many of these issuers may bypass public high yield issuance altogether, relying instead on private markets to meet their financing needs. This shift has materially changed the makeup of the Bloomberg High Yield Index itself. The share of the riskiest bonds has declined meaningfully, while higher quality segments now make up a larger portion of the market (see chart 1).
Chart 1. High yield index ratings quality has improved over last decade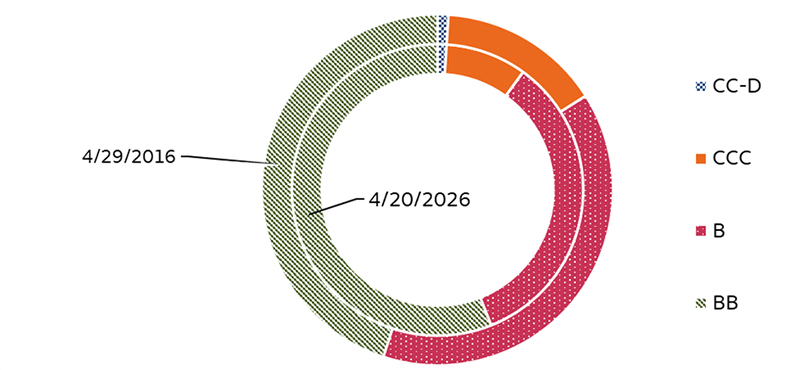
Sources: Bloomberg and Wells Fargo Investment Institute, data as of April 20, 2026, and April 29, 2016. Credit quality classifications are based on Bloomberg data, which reflects an average of ratings from major credit rating agencies. Represented by credit ratings of constituents of the Bloomberg High Yield Bond Index. BB represents the highest credit tranches contained in high yield indexes.
Past performance is no guarantee of future results.
Importantly, many companies in high yield indexes are now larger based on market cap and more profitable. The yield difference is narrow enough to incentivize some borrowers to remain at the high end of high yield (rated BB), rather than cross into the lowest tier of investment grade. According to Moody’s, while high yield issuer defaults have risen from exceptionally low post pandemic levels, they remain close to long term averages — supporting our view that structural risks in high yield remain contained.
We believe the improved quality of the high yield market also helps explain why investor demand has remained resilient. Over the past several weeks, flows into high yield bond funds have increased, suggesting that investors continue to view the asset class as an attractive source of income despite ongoing market uncertainty.1 Yield levels are a key driver of demand. The Bloomberg High Yield Bond Index is currently displaying a yield near 6.75% (as of April 20, 2026), providing potential for compelling income without requiring investors to move into longer maturity bonds with higher interest rate sensitivity.
Our neutral outlook on high yield
Despite these positives, our overall outlook on high yield remains neutral. While structural risks appear limited, valuation is our primary concern. Credit spreads, or the additional compensation investors receive for taking on credit risk, are tight by historical standards (see chart 2). Recent episodes of spread widening have been short-lived, with spreads often retracing toward cycle lows even amid geopolitical tensions and persistent inflation pressures.
Chart 2. Credit spread widenings in high yield have been short lived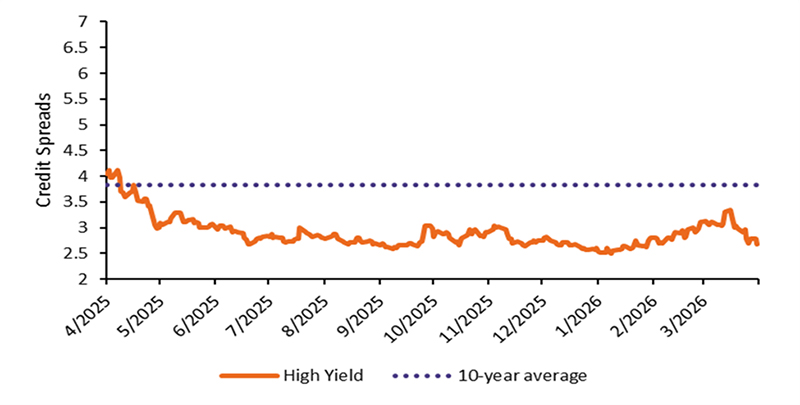
Sources: Bloomberg and Wells Fargo Investment Institute, as of April 15, 2026. Measured by option-adjusted spread (spread relative to a risk-free interest rate) of the Bloomberg High Yield Bond Index. The 10-year average credit spread was 3.84.
Past performance is no guarantee of future results.
With inflation pressures lingering and the Federal Reserve (Fed) less likely to provide near term rate relief, we believe current spreads leave little margin for surprises. High yield also faces a growing maturity wall, with more than half of outstanding debt set to mature over the next five years2 — potentially increasing refinancing pressure on issuers. Demand may be durable if the economy avoids sharp deteriorations in economic growth, but that does not eliminate valuation risk and patience remains warranted.
For yield-focused investors, maintaining a strategic allocation to high yield can still be considered within diversified portfolios. That said, we believe potential pullbacks driven by market volatility or uncertainty may offer opportunities to selectively add exposure. At current levels, we continue to find investment grade bonds attractive, offering potential for competitive yields with less credit risk, while waiting for potentially more compelling entry points in high yield.
1 Lipper fund flows into U.S. high yield bonds, as of April 17, 2025.
2 Measures by Bloomberg Corporate High Yield Index, as of April 24, 2026.
S&P 500 beneath highs, AI has driven returns
Equity markets have taken investors on a full round trip so far this year. The S&P 500 Index reached an all‑time high in January, fell to recent lows in March amid rising geopolitical and economic uncertainty, and then rebounded sharply, ultimately returning to a new all‑time high on April 16, 2026. Notably, this rebound marked the fastest recovery by trading days to a new high following a drawdown of at least 8% since 1950. While we believe the speed of the recovery underscores market resilience, participation has been uneven. Fewer than 60% of S&P 500 Index constituents are trading above their 200‑day moving average, highlighting continued dispersion beneath the surface.
That dispersion may become easier to interpret as markets have shifted their attention away from geopolitics and back toward fundamentals. While the outcome of the war with Iran remains uncertain, we believe equity markets have lately looked through the conflict, once again grading companies and sub‑industries primarily on their exposure to AI. In our view, the market’s report card is considered at the sub‑industry level. Many of the year‑to‑date leaders in the S&P 500 are either direct beneficiaries of AI capital spending or businesses largely insulated from its potentially disruptive effects.
By contrast, some of the S&P 500 weakest performers have been sub‑industries perceived to be most vulnerable to AI‑driven disruption. Business software, professional services, and consulting‑based industries which were previously awarded valuation premiums for seemingly durable competitive moats have struggled as investors reassess how quickly AI could pressure pricing power and erode traditional advantages.
As prospects for de‑escalation in Iran have improved, investor focus has returned to its core curriculum — participating in secular growth trends with solid fundamentals. That shift helps explain our recent sector recommendation changes. In our view, much of the geopolitical risk premium had been priced into oil by early April when we downgraded the Energy sector. At the same time our expectations for more attractive valuations, durable fundamentals, and renewed confidence in AI‑driven growth led us to upgrade the Information Technology sector.
Chart 3. Year-to-date total return of S&P 500 index sub-sectors that are potential beneficiaries, disrupted and insulated from AI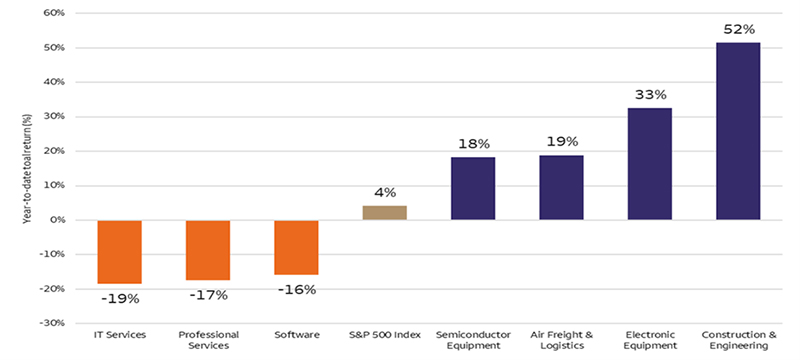
Sources: Bloomberg and Wells Fargo Investment Institute. Data as of April 20, 2026. IT = Information Technology. An index is not managed and not available for direct investment.
Past performance is no guarantee of future results.
Time to consider rebalancing out of commodities
Commodities have spent much of 2026 demonstrating their potential to diversify portfolios during environments that have been tough for more traditional asset classes, such as stocks and bonds. The Bloomberg Commodity Total Return Index (BCOMTR) is up 22.57% year-to-date through April 20, 2026, versus 0.79% for the Bloomberg US Aggregate Bond Index and 4.21% for the S&P 500 Index. The positive performance within BCOMTR has been broad-based and has been led by energy and precious metals.
The drivers of this recent performance have been a war in the Middle East, a still solid U.S. consumer and economy, perky inflation, and a demand for materials related to the AI buildout. While some of these factors may lose strength in the coming months, such as a wind-down of the conflict, it is hard to see most of them reversing any time soon. Unfortunately, much of our thesis for commodities has largely played out and we now see signs that prices for many commodities may be trading more off geopolitics and acute shortages than long-term supply and demand fundamentals would suggest.
For this reason, we remain neutral on Commodities as an asset group, and we downgraded Energy commodities as a sector within the asset group. We believe investors would be well served to consider if suitable, removing exposure from commodities to stocks and bonds and within commodities to our favorable-rated precious and industrial metals sectors.
The chart shows the BCOMTR Index (341) is in an uptrend, with the 50-day moving average (326) now trading above the 200-day moving average (283). It should find support at the 50-day moving average (326) followed by the 200-day moving average (283). Resistance sits at the recent high (351).
Chart 4. Commodities have run hard and fast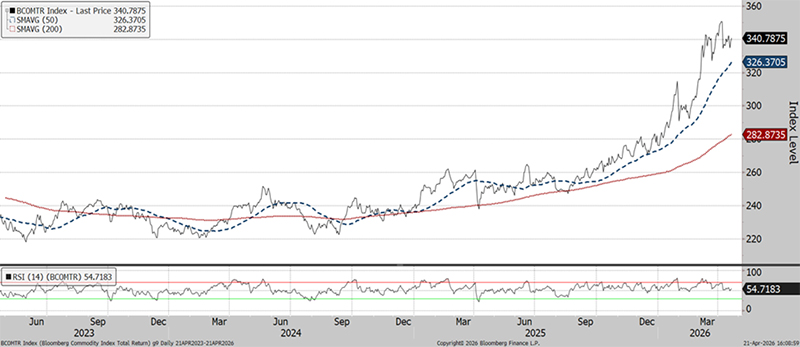
Sources: Bloomberg and Wells Fargo Investment Institute. Daily data from April 20, 2023, through April 20, 2026. BCOMTR = Bloomberg Commodity Index Total Return. SMAVG (50) = 50-day simple moving average. SMAVG (200) = 200-day simple moving average. RSI = relative strength index. An index is not managed and not available for direct investment.
Past performance is no guarantee of future results.
Large AI deals drive record Venture Capital (VC) quarter
VC deal activity surged in the first quarter of 2026, reaching a record $267 billion after several years of relatively muted volumes. AI continues to dominate the landscape, with AI and machine learning (ML) companies accounting for more than 89% of total deal value. This share has steadily increased over recent years, underscoring AI’s growing influence across the VC market.
However, a closer look reveals that this headline number masks some underlying weakness. The record quarter was driven largely by a small number of extremely large transactions. The five biggest deals alone represented approximately $196 billion of total deal value. This unusually narrow concentration in the first quarter suggests that much of the broader VC market remains in a very slow recovery mode outside of these mega deals.
Many investors are hopeful that these outsized transactions will reignite broader activity and encourage capital to flow back into earlier-stage and mid-sized opportunities. Expectations had also been building that a sustained cycle of Fed interest rate cuts would support a new wave of dealmaking. However, those hopes may be challenged as rising oil prices are renewing concerns about inflation, limiting the potential for additional rate cuts throughout the rest of the year.
While the increase in first-quarter deal activity is encouraging, we remain cautious on the overall outlook for VC. AI may indeed drive the next generation of innovative start-ups, but risks remain elevated as traditional business models are disrupted and valuations continue to adjust. Given this environment, we currently favor lower-risk strategies such as Growth Equity and Small- and Mid-Market Buyouts, which focus on more established companies with proven business models and cash flows.
Chart 5. Quarterly VC deal and AI/ML percentage share of all VC deal value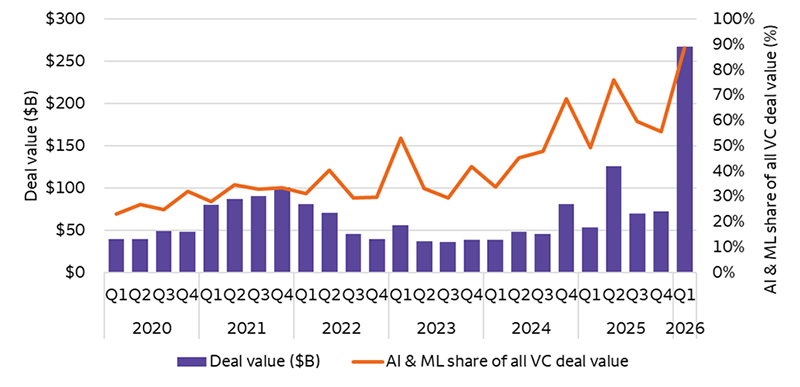
Sources: Pitchbook. Data as of March 31, 2026. Venture capital are generally investments in early-stage U.S. companies with high growth potential, often in the pre-revenue or pre-earnings phase of a company’s life cycle. These companies are typically funded at the pre-seed or seed stage, the early stage (Series A or B), or the late stage (Series C, D, or later). Q = quarter. AI = artificial intelligence. ML = machine learning. VC = venture capital. Please see end of the report for Pitchbook data disclosures.
Past performance is no guarantee of future results.
Alternative investments, such as hedge funds, private equity, private debt and private real estate funds are not appropriate for all investors and are only open to “accredited” or “qualified” investors within the meaning of U.S. securities laws.
Cash Alternatives and Fixed Income
intentionally blank
intentionally blank
intentionally blank
| Most Unfavorable |
Unfavorable |
Neutral |
Favorable |
Most Favorable |
|
intentionally blank
|
- U.S. Long Term Taxable Fixed Income
- U.S. Short Term Taxable Fixed Income
|
- Cash Alternatives
- Developed Market Ex-U.S. Fixed Income
- Emerging Market Fixed Income
- High Yield Taxable Fixed Income
|
- U.S. Intermediate Term Taxable Fixed Income
|
intentionally blank
|
Equities
| Most Unfavorable |
Unfavorable |
Neutral |
Favorable |
Most Favorable |
|
intentionally blank
|
|
- Developed Market Ex-U.S. Equities
- Emerging Market Equities
|
- U.S. Large Cap Equities
- U.S. Mid Cap Equities
|
intentionally blank
|
Real Assets
| Most Unfavorable |
Unfavorable |
Neutral |
Favorable |
Most Favorable |
|
intentionally blank
|
intentionally blank
|
- Commodities
- Private Real Estate
|
|
intentionally blank
|
Alternative Investments**
| Most Unfavorable |
Unfavorable |
Neutral |
Favorable |
Most Favorable |
|
intentionally blank
|
intentionally blank
|
- Hedge Funds—Equity Hedge
- Hedge Funds—Macro
- Hedge Funds—Relative Value
- Private Equity
- Private Debt
|
|
intentionally blank
|
Source: Wells Fargo Investment Institute, April 27, 2026. Please see Wells Fargo Investment Institute's Asset Allocation Strategy Report for more detailed, investable ideas in each asset group.
*Tactical horizon is 6-18 months
**Alternative investments are not appropriate for all investors. They are speculative and involve a high degree of risk that is appropriate only for those investors who have the financial sophistication and expertise to evaluate the merits and risks of an investment in a fund and for which the fund does not represent a complete investment program. Please see end of report for important definitions and disclosures.