Managing concentration risk in a portfolio
Diversification is a cornerstone of asset allocation, achieved by holding a broad mix of assets across classes, sectors, and geographies. A well-diversified portfolio — including allocations to equities, fixed income, real assets, and alternative investments — can help investors navigate volatility that an individual security, asset class, or sector might experience.
Despite its importance, concentration risk is an often overlooked yet crucial aspect of asset management. Portfolios with sizable exposures — whether to an individual security or asset, sector or sub-sector, or geographic region — are vulnerable to significant losses. Even when diversification is an investor’s objective, portfolios may unintentionally become concentrated over time, increasing the risk of significant losses if the concentrated assets perform poorly.
We believe that asset diversification is essential for managing concentration risk effectively. We deem an allocation to an individual security, sector, or sub-sector that exceeds 10%, a concentrated position. Various reasons may cause portfolio positions to accumulate, including compensation in company stock; building a large real estate portfolio; selling a privately held company and receiving stock proceeds in exchange; or inheriting a sizable amount of a single asset.
Examples of concentrated assets
A few examples of concentrated asset positions include portfolios overconcentrated in equities, fixed income, or cash. Each type of asset overconcentration can amplify volatility and reduce a portfolio’s capacity to weather downturns or capture upside potential.
Equity concentration: Equities are typically the growth engine of a portfolio, but excessive exposure to stocks can lead to heightened volatility. A portfolio heavily tilted toward equities may perform well during bull markets but suffer disproportionate losses during downturns. For example, in the early 2000s, portfolios with large positions in internet stocks suffered losses, and during the 2008 financial crisis, investors overallocated to real estate experienced steep drawdowns. Moreover, sectors or sub-sectors can experience periods of volatility where the subsectors outperform — or underperform — a broader index (see Chart 1). Overconcentration within equities today, such as substantial exposure to artificial intelligence (AI)-related or a handful of mega tech stocks, may pose certain risk should those sectors sell off — like we observed in January 2025.
Fixed-income concentration: U.S. Treasury and Investment-grade bonds historically have been less volatile than equities. However, overconcentration in fixed income can expose a portfolio to certain risks. Rising interest rates can erode bond prices, especially long-term bonds. Holding large allocations to lower-rated bonds increases the chance of experiencing a default. In low-rate environments, fixed-income investors seeking yield may choose to skew their holdings to these riskier bonds, compounding potential losses. Inflation also poses a risk to bondholders as fixed-income returns may not keep pace with inflation.
Chart 1. Performance of Information Technology sector and sub-sectors vary over time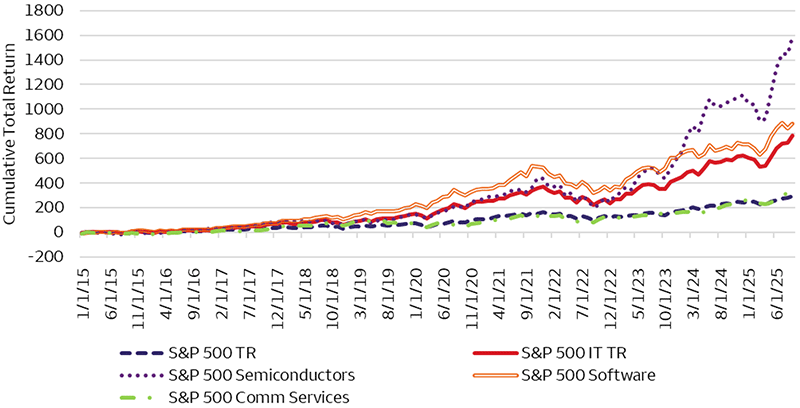
Source: Bloomberg, data as of October 21, 2025. S&P 500 Index, IT Sector Index, Semiconductor subindex, Software subindex, Communication Services subindex. TR = total return assumes reinvestment of dividends and or interest.
Past performance is no guarantee of future results. An index is not managed and not available for direct investment. Chart for illustrative and educational purposes only and does not reflect actual trading of any securities or portfolio. See pages 9-10 for index definitions. Index to 0 on January 1, 2015.
Cash and cash-alternatives concentration: While cash (alternatives) can provide liquidity and stability for a portfolio, our research suggests that holding too much cash may impede long-term portfolio growth. Over time, a cash-heavy portfolio may fail to meet an investor’s investment objectives, especially for long-term goals like retirement. Moreover, excessive cash holdings can reflect market-timing behavior, which may impede performance.
Managing concentration risk
Concentration risk can undermine a portfolio’s resilience and long-term performance. To help mitigate concentration risk, investors might consider the following strategies:
- Diversify across and within asset classes: Maintain a broad mix of equities, fixed income, real assets, and alternative investments (for qualified investors) across sectors and geographies that is tailored to an investor’s return objective, risk tolerance, and time horizon.
- Adhere to an appropriate investment objectives: Review portfolio allocations and rebalance holdings to target weights regularly.
- Avoid behavioral biases: Be wary of common investor tendencies like chasing winners and losers or recency bias — using recent experience as a baseline for measuring risk and return.
We advise investors to select an asset allocation strategy that is based on their financial goals, time horizon, and ability and willingness to withstand market ebbs and flows. By maintaining a mix of assets, we believe investors can better navigate market volatility and potentially smooth returns. And under certain market conditions, it may make sense to take action on tactical opportunities by increasing exposure to a favorable asset class or sector.
We recommend reviewing a portfolio’s asset allocation, at least annually, to ensure that it continues to align with the designated return objective and risk tolerance. We encourage investors to talk with an investment professional about questions or concerns they may have about concentration risk or their portfolio’s asset allocation strategy.
U.S. Government Shutdown: Potential impact on equity markets
The government shutdown has now entered its fifth week with no prospect of a solution. Talks are going nowhere as Senate Democrats have demanded that health care subsidies from the Affordable Care Act (ACA) passed during the COVID-19 era be extended as part of any funding bill, while Republicans insist on opening the government first before negotiating.
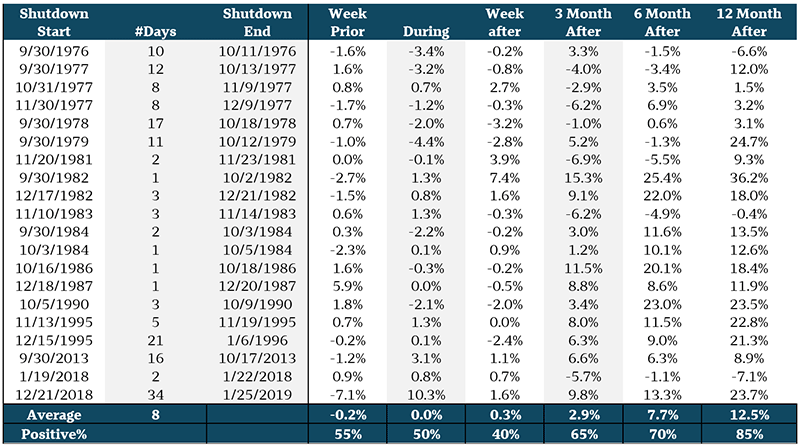
Since 1976, there have been 20 government shutdowns lasting for a day or more. The most recent one in December 2018 lasted 34 days, setting a record as the longest in U.S. history (see Table 1). As shown, government shutdowns have had little lasting impact on equity performance. Stocks were positive half the time during the government closures and were higher in most cases three, six, and 12 months later.
This shutdown is different from the prior shutdown since during the December 2018 shutdown, five of the 12 appropriations bills had been passed, and the bulk of discretionary nonessential spending was all set. This time, it is a full shutdown with all nonessential spending affected. Secondly, the Trump administration has indicated that it could use the shutdown as an opportunity to reduce the federal workforce and cut programs that do not align with the president’s agenda.
We think there is an increased risk of a longer shutdown this time, but the markets’ sanguine response so far illustrates a view that the labor market is strong enough to support these potential layoffs. We do not know how long the shutdown will last, but our guidance remains to look through the event to what we expect will be the main drivers of the economy and investment returns through the next 12 – 15 months. These drivers include deregulation, extensive tax cuts for businesses and households, a trajectory for further Federal Reserve (Fed) interest rate cuts, and a solid trend for further technology spending.
Table 1. Market action around Federal government shutdowns (S&P 500 returns %)
| Shutdown Start |
#Days |
Shutdown End |
Week Prior |
During |
Week after |
3 Month After |
6 Month After |
12 Month After |
| 9/30/1976 |
10 |
10/11/1976 |
-1.6% |
-3.4% |
-0.2% |
3.3% |
-1.5% |
-6.6% |
| 9/30/1977 |
12 |
10/13/1977 |
1.6% |
-3.2% |
-0.8% |
-4.0% |
-3.4% |
12.0% |
| 10/31/1977 |
8 |
11/9/1977 |
0.8% |
0.7% |
2.7% |
-2.9% |
3.5% |
1.5% |
| 11/30/1977 |
8 |
12/9/1977 |
-1.7% |
-1.2% |
-0.3% |
-6.2% |
6.9% |
3.2% |
| 9/30/1978 |
17 |
10/18/1978 |
0.7% |
-2.0% |
-3.2% |
-1.0% |
0.6% |
3.1% |
| 9/30/1979 |
11 |
10/12/1979 |
-1.0% |
-4.4% |
-2.8% |
5.2% |
-1.3% |
24.7% |
| 11/20/1981 |
2 |
11/23/1981 |
0.0% |
-0.1% |
3.9% |
-6.9% |
-5.5% |
9.3% |
| 9/30/1982 |
1 |
10/2/1982 |
-2.7% |
1.3% |
7.4% |
15.3% |
25.4% |
36.2% |
| 12/17/1982 |
3 |
12/21/1982 |
-1.5% |
0.8% |
1.6% |
9.1% |
22.0% |
18.0% |
| 11/10/1983 |
3 |
11/14/1983 |
0.6% |
1.3% |
-0.3% |
-6.2% |
-4.9% |
-0.4% |
| 9/30/1984 |
2 |
10/3/1984 |
0.3% |
-2.2% |
-0.2% |
3.0% |
11.6% |
13.5% |
| 10/3/1984 |
1 |
10/5/1984 |
-2.3% |
0.1% |
0.9% |
1.2% |
10.1% |
12.6% |
| 10/16/1986 |
1 |
10/18/1986 |
1.6% |
-0.3% |
-0.2% |
11.5% |
20.1% |
18.4% |
| 12/18/1987 |
1 |
12/20/1987 |
5.9% |
0.0% |
-0.5% |
8.8% |
8.6% |
11.9% |
| 10/5/1990 |
3 |
10/9/1990 |
1.8% |
-2.1% |
-2.0% |
3.4% |
23.0% |
23.5% |
| 11/13/1995 |
5 |
11/19/1995 |
0.7% |
1.3% |
0.0% |
8.0% |
11.5% |
22.8% |
| 12/15/1995 |
21 |
1/6/1996 |
-0.2% |
0.1% |
-2.4% |
6.3% |
9.0% |
21.3% |
| 9/30/2013 |
16 |
10/17/2013 |
-1.2% |
3.1% |
1.1% |
6.6% |
6.3% |
8.9% |
| 1/19/2018 |
2 |
1/22/2018 |
0.9% |
0.8% |
0.7% |
-5.7% |
-1.1% |
-7.1% |
| 12/21/2018 |
34 |
1/25/2019 |
-7.1% |
10.3% |
1.6% |
9.8% |
13.3% |
23.7% |
| Average |
8 |
|
-0.2% |
0.0% |
0.3% |
2.9% |
7.7% |
12.5% |
| Positive% |
|
|
55% |
50% |
40% |
65% |
70% |
85% |
Sources: History, Art & Archives, and U.S. House of Representatives, “Funding Gaps and Shutdowns in the Federal Government,” October 22, 2025. An index is not managed and not available for direct investment.
Past performance is not a guarantee of future results.
Negative positions against the U.S. dollar build
While the U.S. dollar has stemmed some of its losses from early in the year, market participants appear unconvinced. Despite increased investment in U.S. dollar-denominated assets from abroad, many traders (speculators) have continued to bet against the dollar throughout 2025; partially from investors looking to hedge their exposures to assets priced in dollars and partially from those looking to directly bet on a further depreciation. The chart (see Chart 2) below shows that foreign exchange traders are heavily invested in euro and yen contracts, expecting these currencies to strengthen relative to the dollar.
Chart 2. Speculator net positions in euro and yen futures contracts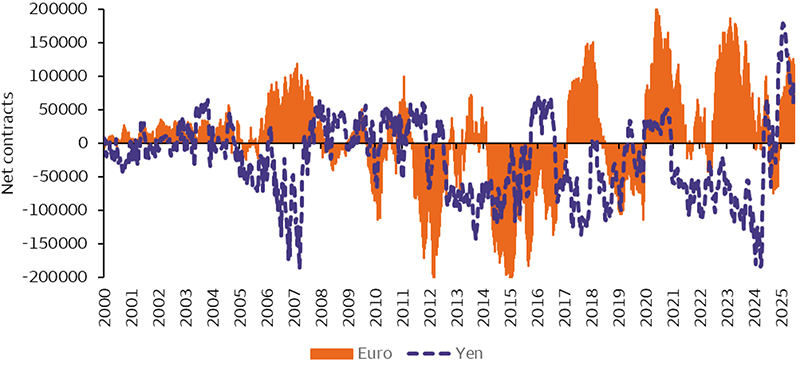
Sources: Bloomberg and Wells Fargo Investment Institute as of September 23, 2025. Speculator net contracts represented by non-commercial contracts in U.S. futures contracts as reported by the Commitments of Traders report (CFTC). A positive number represents a net long position in the currency and a negative number a net short position.
This reflects widespread pessimism about the dollar, which could weigh on its performance in the near term. This may be magnified if concerns that could impact the dollar, such as continued rate cuts or a U.S. economic soft patch build into early 2026. As of late October, we see the potential for a slight retread lower in the dollar moving into year-end 2025.
As we look into 2026, we believe this widely negative view for the dollar should dissipate. In our view, it would not take much of a sentiment shift next year to lead many investors to reverse their bets against it — potentially boosting its value as they rush to fill these negative positions. This shift in sentiment could be caused by a host of factors including an early stall in the Fed’s rate cutting cycle, stronger U.S. growth, or rising political risks internationally — all of which we see as significant possibilities. We continue to forecast a slight rebound in the dollar by year-end 2026. This outlook for added dollar strength contributes to our preference for U.S. equities and fixed income over international.
Oil supply a sizeable headwind
call out “Life isn’t about waiting for the storm to pass. It’s about learning how to dance in the rain.”
— Vivian Green end call out
Last week, West Texas Intermediate (WTI) oil traded near the 2025 low in the mid-$50s before announced U.S. sanctions on Russian oil producers caused a late week spike (see Chart 3).
What happened to drive prices near the lows of the year? In short, supply has overwhelmed demand, while the geopolitical risk premium that had been embedded in prices had been reduced. The oversupply condition is largely due to OPEC+ , which has been bringing previously idle oil production back online. Meanwhile, de-escalation of conflicts in the Middle East, as well as market expectations of the same for Russia’s war in Ukraine helped drag prices lower—that is before announced U.S. sanctions on Russia caused a 5% spike as those expectations were dashed. Still, even after the announced sanctions, WTI oil price only reached an intraday level on October 23 near $62 per barrel—well below the $80 early year high, as supply remains a sizeable headwind.
What now? We believe a modest softening of the economy in the near term, combined with OPEC+’s seemingly aggressive intention of adding oil supply, will keep oil prices under pressure in the coming months. However, we believe this supply deluge will eventually ease. WTI oil prices are below the $65 average breakeven cost for new oil wells in the U.S. This suggests that U.S. oil production growth will likely stall, as it becomes unprofitable for an increasing number of domestic oil producers to drill new wells as oil prices decline further. Additionally, the OPEC+ campaign to increase production is on track to conclude in 2026, notably tightening the global oil-supply spigot.
Looking through to year-end 2026, we forecast the improving supply outlook, coupled with a reaccelerating economy, will push WTI oil prices into our target range of $65-$75 per barrel.
Chart 3. Oil prices revisited 2025 lows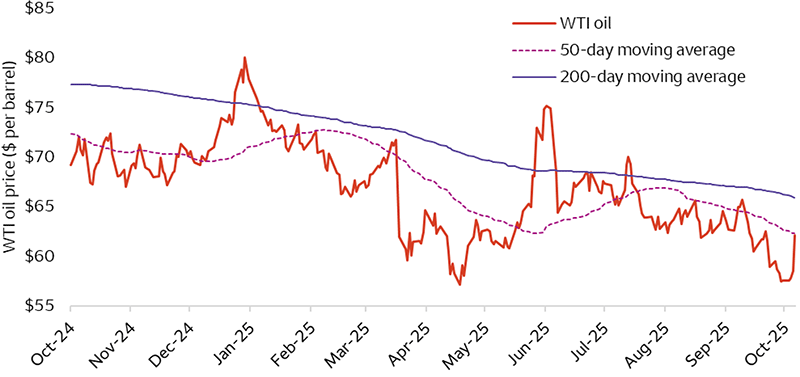
Sources: Bloomberg and Wells Fargo Investment Institute, data is from October 18, 2024, through October 23, 2025.
Past performance is no guarantee of future results.
Liquid alternative strategies rose with equities in third quarter
We reviewed third-quarter 2024 and year-to-date performance data for liquid alternative Equity Hedge, Event Driven, Global Macro, and Relative Value strategies. Performance across various Wilshire Liquid Alternative indexes, which track the respective liquid alternative mutual funds, reflect these trends (see Chart 4). We have also shown the S&P 500 Index which rallied during the third quarter, driven by strong corporate earnings, enthusiasm behind AI, and a rate cut by the Fed.
- The Wilshire Liquid Alternative Equity Hedge Index reported gains in August and September mostly from Fundamental Long/Short Equity sub-strategies as the environment was favorable for stock picking. Growth and momentum-oriented stock selection and factors drove gains. Value factor also drove gains, particularly among small-cap stocks.
- The Wilshire Liquid Alternative Event Driven Index reported gains as several corporate mergers made significant progress towards deal completion. Corporate spinoff and restructuring events also progressed well, with limited impact from the impending U.S. government shutdown.
- The Wilshire Liquid Alternative Global Macro Index reported gains from price-based trend-following strategies. Gold prices hit multiple fresh record highs, while silver prices hit a 14-year high during the quarter, which resulted in gains. Global Macro strategies recovered from losses suffered during the second quarter, showing year-to-date gains.
- The Wilshire Liquid Alternative Relative Value Index reported small gains as credit spreads tightened from the tariff-related spikes in April and June. Interest rate duration exposures contributed as the Fed cut rates by 25 basis points (0.25%) in September. Convertible bond strategies contributed as the bonds captured some of the underlying stock’s price appreciation.
Chart 4. Performance of S&P 500 and Wilshire Liquid Alternative indexes during third-quarter and year-to-date 2025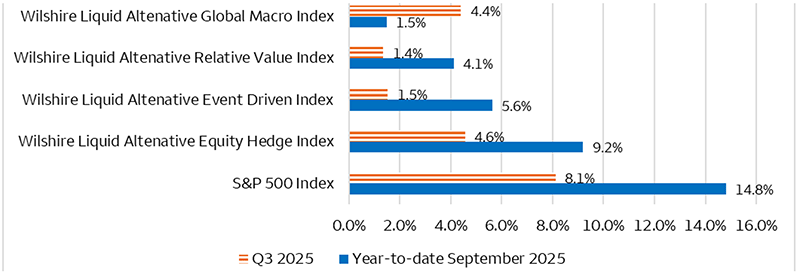
Sources: Bloomberg and Wells Fargo Investment Institute. Data from January to September 2025. Wilshire Liquid Alternative Equity Hedge, Event Driven, Global Macro, and Relative Value indexes provide representative performance of the four broad categories of hedge funds used within Wells Fargo Investment Institute. These indexes have daily track records going back to July 2014 and include ’40 Act mutual funds that have at least six months of returns for being included in the index. Included funds pursue the respective investment strategy as defined by Wilshire Manager Research.
Past performance is no guarantee of future results.
Alternative investments, such as hedge funds, private equity, private debt and private real estate funds are not appropriate for all investors and are only open to “accredited” or “qualified” investors within the meaning of U.S. securities laws.
Cash Alternatives and Fixed Income
| Most Unfavorable |
Unfavorable |
Neutral |
Favorable |
Most Favorable |
|
intentionally blank
|
- U.S. Long Term Taxable Fixed Income
- U.S. Short Term Taxable Fixed Income
|
- Cash Alternatives
- Developed Market Ex-U.S. Fixed Income
- Emerging Market Fixed Income
- High Yield Taxable Fixed Income
|
intentionally blank
|
- U.S. Intermediate Term Taxable Fixed Income
|
Equities
| Most Unfavorable |
Unfavorable |
Neutral |
Favorable |
Most Favorable |
|
intentionally blank
|
- Emerging Market Equities
- U.S. Small Cap Equities
|
- Developed Market Ex-U.S. Equities
|
- U.S. Large Cap Equities
- U.S. Mid Cap Equities
|
intentionally blank
|
Real Assets
| Most Unfavorable |
Unfavorable |
Neutral |
Favorable |
Most Favorable |
|
intentionally blank
|
intentionally blank
|
- Commodities
- Private Real Estate
|
intentionally blank
|
intentionally blank
|
Alternative Investments**
| Most Unfavorable |
Unfavorable |
Neutral |
Favorable |
Most Favorable |
|
intentionally blank
|
intentionally blank
|
- Hedge Funds—Equity Hedge
- Hedge Funds—Relative Value
- Private Equity
- Private Debt
|
- Hedge Funds—Event Driven
- Hedge Funds—Macro
|
intentionally blank
|
Source: Wells Fargo Investment Institute, October 27, 2025.
*Tactical horizon is 6-18 months
**Alternative investments are not appropriate for all investors. They are speculative and involve a high degree of risk that is appropriate only for those investors who have the financial sophistication and expertise to evaluate the merits and risks of an investment in a fund and for which the fund does not represent a complete investment program. Please see end of report for important definitions and disclosures.


 Source: Bloomberg, data as of October 21, 2025. S&P 500 Index, IT Sector Index, Semiconductor subindex, Software subindex, Communication Services subindex. TR = total return assumes reinvestment of dividends and or interest. Past performance is no guarantee of future results. An index is not managed and not available for direct investment. Chart for illustrative and educational purposes only and does not reflect actual trading of any securities or portfolio. See pages 9-10 for index definitions. Index to 0 on January 1, 2015.
 Sources: Bloomberg and Wells Fargo Investment Institute as of September 23, 2025. Speculator net contracts represented by non-commercial contracts in U.S. futures contracts as reported by the Commitments of Traders report (CFTC). A positive number represents a net long position in the currency and a negative number a net short position.
 Sources: Bloomberg and Wells Fargo Investment Institute, data is from October 18, 2024, through October 23, 2025. Past performance is no guarantee of future results.
  Sources: Bloomberg and Wells Fargo Investment Institute. Data from January to September 2025. Wilshire Liquid Alternative Equity Hedge, Event Driven, Global Macro, and Relative Value indexes provide representative performance of the four broad categories of hedge funds used within Wells Fargo Investment Institute. These indexes have daily track records going back to July 2014 and include ’40 Act mutual funds that have at least six months of returns for being included in the index. Included funds pursue the respective investment strategy as defined by Wilshire Manager Research. Past performance is no guarantee of future results.