No great rotation yet
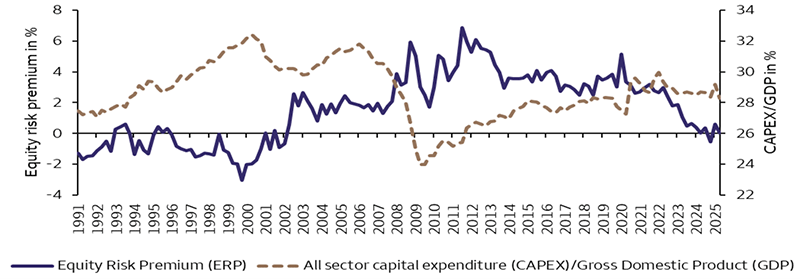
As the S&P 500 Index has reached new highs as we approach the close of the third quarter of 2025, the equity risk premium (ERP) has turned negative. ERP, measured by the difference between the S&P 500 Index earnings yield (earnings/price) and the 10-year U.S. Treasury yield, typically is viewed as a premium that equity investors require for taking on equity market risk. The near zero ERP recently and, even more, the negative value in late 2024 (Chart 1) raises the question of whether equity investors are complacent to market risks and overallocating to the equity market despite declining risk-reward.
In turn, that question begs another — Is it time to rotate from equity to fixed-income allocations?
Maintain a neutral stock and bond mix in your allocation
Even though ERP turned negative and we recently recommended that investors consider trimming U.S. Large Cap exposure to take profits, we believe it may be too early to significantly increase bond allocations. Our positioning — across all investment objectives—remains generally neutral relative to our long-term strategic targets for equity versus bond allocations.
As Chart 1 shows historically, the ERP remained negative for extended periods when the economy was helped by capital expenditures. From the end of 1990 until the dotcom bubble burst in 2000, the S&P 500 Index generated an annualized 20%1 total return from December 1990 to December 1999 even as the ERP remained negative for nearly a decade. While we recognize the concentration risk2 in the S&P 500 Index today, it is difficult to argue that a meaningful rotation into bonds is warranted at this time. In fact, we recently raised our equity targets, as we believe the macroeconomic environment will continue to support equity markets in 2026.3
Chart 1. Equity risk premium was negative in the 1990s when equities rallied
Sources: Bloomberg and St. Louis Federal Reserve. Quarterly data as of Q2, 2025. ERP, measured by the difference between the S&P 500 Index earnings yield (earnings/price) and the 10-year U.S. Treasury yield
Re-evaluate your income generation strategy and risk tolerance
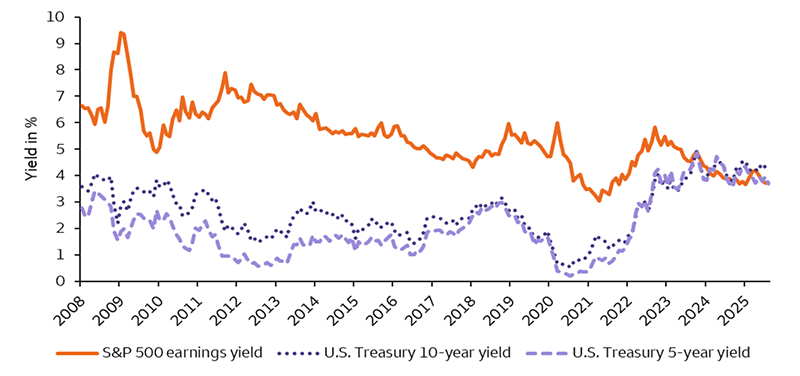
Diving deeper into the ERP decline since 2008, we see earnings yields diminishing while U.S. Treasury yields since 2020 have risen, as shown in Chart 2. Even though a negative ERP alone does not signal a market decline is imminent, a long-term trend of declining ERP offers other insights. We believe it is time for investors to re-examine potential sources of income generation.
During periods of financial repression — characterized by government policies to maintain low-to-negative interest rates — income-seeking investors historically have turned to high-quality dividend-paying stocks to generate income with the potential for capital appreciation. Currently, we believe investors would be wise to evaluate whether they have acquired equity risk in excess of their risk tolerance, especially in today’s environment where equity price levels and market risks are disproportionately represented by growth stocks related to artificial intelligence.
To be clear, for portfolios that remain aligned with their risk tolerance, we still favor high-quality dividend-paying U.S. companies. However, for investors whose risk tolerance may have drifted due to a desire for income or asset growth, we believe this is a good time for a review to anchor at the appropriate long-term portfolio risk tolerance level and to consider new opportunities that fixed-income assets offer today.
We believe the zero-interest-rate policy (ZIRP) era is over. As U.S. Treasury yields surpass equity earnings yields, investors may consider competitive income streams from diversified bond allocations. We currently favor the intermediate-term (3- to 7-year) portion of the curve.
Chart 2. Earnings yields have crossed the 5-year and 10-year U.S. Treasury yield
Sources: Bloomberg and Wells Fargo Investment Institute. Monthly data as of August 29, 2025. Current yields may be higher or lower than those quoted. An index is not managed and not available for direct investment.
Past performance is not a guarantee of future results. This chart is for illustrative purposes only and does not constitute investment advice.
1 Bloomberg. Annualized S&P 500 Index total return from December 1990 to December 1999.
2 Concentration risk here refers to the fact that the largest seven companies (Mag 7) weigh heavily in the S&P 500 price index today.
3 “Adjusting targets and equity sector guidance,” Wells Fargo Investment Institute, September 16, 2025.
Stocks are less expensive than they appear
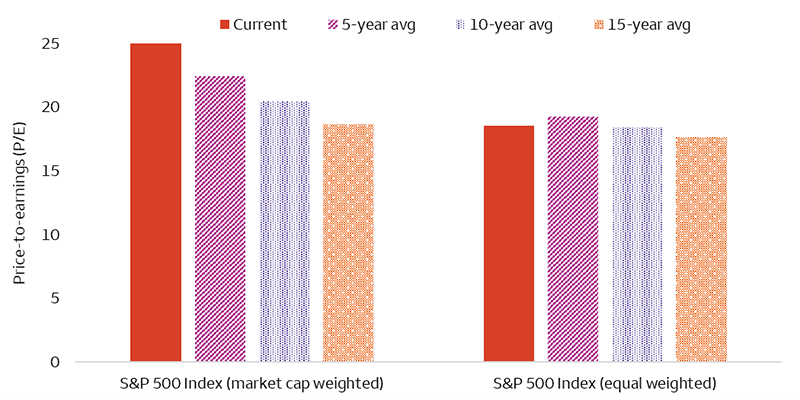
With a price to earnings (P/E) of 25x, the S&P 500 Index is trading at historically high valuations. The S&P 500 Index is a market cap-weighted index, meaning that the largest companies significantly influence the index’s performance and valuations. The Information Technology sector, plus the technology-related companies in the Communication Services and Consumer Discretionary sectors, today command a high valuation and currently make up nearly 50% of the market cap weighted S&P 500 Index.
When we reduce the influence of these companies by equally weighting all constituents of the S&P 500 Index, we see that stocks are generally not as expensive as the 25x multiple would suggest. In fact, the typical stock is trading in line with its historical averages — certainly not cheap, but we do not believe excessively expensive either (see chart). With valuation full, as evidenced by the high P/E multiple, we expect equities to be driven by robust earnings growth rather than multiple expansion.
Our 2026 year-end price and earnings per share (EPS) targets are 7500 and $300, respectively. This implies a similar 25x P/E multiple by year-end 2026. Given the upside we still see in equities through year-end 2026, we would view meaningful pullbacks as opportunities to add exposure consistent with our guidance. We are favorable on U.S. Large and U.S. Mid Caps, neutral on Developed Markets ex. U.S., and unfavorable on U.S. Small Caps and Emerging Market Equities.
Market cap versus equal weight P/E ratio comparison
Sources: Bloomberg and Wells Fargo Investment Institute. Data as of September 19, 2025. Start date for 5 year: September 19, 2020; Start date for 10 year: September 19, 2015; Start date for 15-year: September 19, 2010. End date for all series: September 19, 2025. An index is not managed and not available for direct investment.
Past performance is not a guarantee of future results.
Resilience of the high-yield bond market
So far this year, the Bloomberg U.S. Corporate High Yield Bond Index has managed to deliver modest positive returns, leading the way amongst U.S. fixed-income strategic asset classes. It appears that the U.S. high-yield bond market has mostly shrugged off any macroeconomic concerns and has been supported by credit-risk demand.
Fundamentals for this asset class also appear to be solid. Positive earnings growth among high-yield corporate bond issuers has maintained leverage multiples (as measured by median net debt to earnings before interest, taxes, depreciation, and amortization, or EBITDA) stable near 3.5x4 earnings over the past two years. Additionally, distressed ratios, which measure the amount of securities that are already in default, under bankruptcy protection, or in distress divided by the total number of issues, have improved to 4.04% down from 5.05% just over a year ago.5 Given these factors, we believe that any near-term weakness in the high-yield space will most likely not be driven by market fundamentals but instead by larger macro forces and volatility on concerns about the economy, tariffs, or Federal Reserve (Fed) policy surprises.
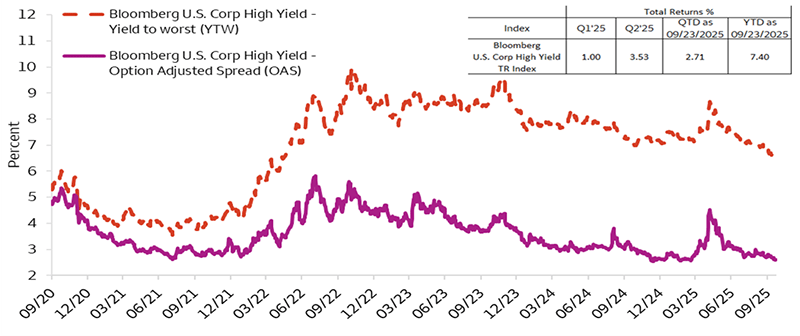
Although yields remain attractive, around 6.59%,6 and can provide cushion in case interest rates or credit spreads were to rise abruptly, we still believe that a neutral allocation seems prudent. The current levels of high-yield credit spreads remain a concern given how low they have reached; hence making HY bond valuations somewhat expensive.
High yield bonds: attractive yields but tight credit spreads
Sources: Bloomberg and Wells Fargo Investment Institute. Daily data from September 1, 2020, to September 23, 2025. QTD = quarter to date. YTD = year to date. Yield to Worst (YTW) is the lowest potential yield an investor can receive on a bond without the issuer defaulting. Option-adjusted spread (OAS) is the spread relative to a risk-free interest rate. Current yields may be higher or lower than those quoted. An index is unmanaged and not available for direct investment.
Past performance is no guarantee of future results.
4 Bloomberg, as of June 30, 2025.
5 Pitchbook, Morningstar U.S High Yield Bond Index, as of September 19, 2025.
6 Bloomberg, as of September 23, 2025.
We expect gold to advance further
Gold spot prices advanced another 10% over the past month7 after a consolidation phase from April to mid-August, with a year-to-date gain of 42.8%, as of September 22. Key factors behind gold’s latest surge include:
- Federal Reserve (Fed) easing: Weak employment reports in July and August, along with significant downward revisions in job gains from the previous year, have led to expectations for more Fed easing.
- U.S. dollar weakness: Although the U.S. dollar has stabilized over the past several months from its steep decline earlier this year, the downward trend has continued.
- Strong investor and central bank demand: The current economic environment has resulted in consistent high levels of gold purchases through exchange-traded funds (ETFs) and global central banks, particularly in China – according to the World Gold Council.
Looking ahead
We recently increased our year- end gold targets for both 2025 and 2026 based on expectations for lower interest rates (for both short-term and longer-term) and a softer dollar.8 Fed easing combined with still elevated inflation indicates lower short-term real rates, which historically has been bullish for gold prices. In addition, we lowered our 2025 and 2026 year-end targets for the U.S. dollar, another positive factor for gold prices.
Finally, it is important to note that previous gold rallies tended to last for an extended period. As seen in the chart, price rallies in the 1970’s and early 2000’s were sustained for upwards of 10 years. The current upsurge in gold prices that commenced in 2022, coincided with massive monetary and fiscal stimulus due to the pandemic. While no two periods are the same, our 2026 targets of $3,900 - $4,100 per troy ounce reflect our belief that gold’s current price rally still has room to grow.
Gold rallies
Sources: Bloomberg and Wells Fargo Investment Institute. Monthly spot price data per troy ounce is from January 1970 – August 2025, and indexed to 100 as of the start date of each price rally. Periods measured included January 30, 1970 – January 31, 1980, January 31, 2000 – August 31, 2011, and September 30, 2022 – August 29, 2025. Median is calculated for the first 120 months of performance for consistency across price rallies.
Past performance is not a guarantee of future performance.
7 August 31, 2025 – September 22, 2025.
8 “Adjusting targets and equity sector guidance,” Wells Fargo Investment Institute, September 16, 2025.
Small- and middle-market buyouts continue to shine
Private Equity – Small / Mid Buyout sub-strategies continue to outpace their large buyout peers9. As shown in the chart, small- and middle-market buyout funds have outperformed Large Buyout sub-strategies over a three-year, five-year, and ten-year basis. Several structural factors may account for this performance in Small / Mid Buyout sub-strategies compared to Large Buyout sub-strategies most notably:
- Less efficient market: While smaller companies (revenues less than $250 million) vastly outnumber their larger counterparts (by over 12X), small- and middle-market buyout strategies account for only about 15% of the capital raised.10
- Lower valuations: Smaller buyout deals often have lower valuations compared to Large Buyout sub-strategies.
- Greater ability to add value: Small buyout strategies may have more opportunities to add value by recruiting talented management to streamline operations and drive productivity gains.
Moreover, higher interest rates in recent years also led investors to gravitate towards small- and middle-market buyout deals as financing became more constrained in the public debt markets. Small buyouts were often financed by private direct lenders, which continued to provide significant capital for new loan originations despite the challenging lending conditions.
Yet, while investor preference for more digestible debt financings may have benefited Small / Mid Buyout sub-strategies,11 the higher debt service costs may have also negatively impacted smaller-sized businesses disproportionately. If the Federal Reserve continues to reduce short-term interest rates as we expect, it may bring spur greater levels of activity across buyout markets. Yet, at this point, we continue to favor Small / Mid Buyout sub-strategies as the forecast for lower short-term interest rates and our expectations for an economic recovery in 2026 should serve as a favorable backdrop.
U.S. private equity middle-market buyout value as a share of all private equity buyout value
Sources: Preqin and Wells Fargo Investment Institute. Data as of March 31, 2025. Private Equity – Buyout indexes include funds that report to the Preqin database that are primarily focused on purchasing at least a controlling percentage of a company's stock to take over its assets and operations. For the above chart, the delineation of Buyout sub-strategies is as follows: Vintage 1992–1996; Small Buyout ≤ $200 million; Mid-sized Buyout $200 million–$500 million; and Large Buyout > $500 million. Vintage 1997–2004: Small Buyout ≤ $300 million; Mid-sized Buyout $300 million–$750 million; Large Buyout $751 million–$2 billion; and Mega Buyout > $2 billion. Vintage 2005 – present: Small Buyout ≤ $500 million; Mid-sized Buyout $500–$1.5 billion; Large Buyout $1.5 billion–$4.5 billion; and Mega Buyout > $4.5 billion.
Alternative investments, such as hedge funds, private equity, private debt and private real estate funds are not appropriate for all investors and are only open to “accredited” or “qualified” investors within the meaning of U.S. securities laws.
9 Large buyout peers defined by Preqin in the chart.
10 RCP Advisors – The Case for Small Buyouts Part I: Observed Structural Advantages in the Lower Middle Market.
11 Pitchbook U.S. PE Middle Market Report Q2 2025.
Cash Alternatives and Fixed Income
| Most Unfavorable |
Unfavorable |
Neutral |
Favorable |
Most Favorable |
|
intentionally blank
|
- U.S. Long Term Taxable Fixed Income
- U.S. Short Term Taxable Fixed Income
|
- Cash Alternatives
- Developed Market Ex-U.S. Fixed Income
- Emerging Market Fixed Income
- High Yield Taxable Fixed Income
|
intentionally blank
|
- U.S. Intermediate Term Taxable Fixed Income
|
Equities
| Most Unfavorable |
Unfavorable |
Neutral |
Favorable |
Most Favorable |
|
intentionally blank
|
- Emerging Market Equities
- U.S. Small Cap Equities
|
- Developed Market Ex-U.S. Equities
|
- U.S. Large Cap Equities
- U.S. Mid Cap Equities
|
intentionally blank
|
Real Assets
| Most Unfavorable |
Unfavorable |
Neutral |
Favorable |
Most Favorable |
|
intentionally blank
|
intentionally blank
|
- Commodities
- Private Real Estate
|
intentionally blank
|
intentionally blank
|
Alternative Investments**
| Most Unfavorable |
Unfavorable |
Neutral |
Favorable |
Most Favorable |
|
intentionally blank
|
intentionally blank
|
- Hedge Funds—Equity Hedge
- Hedge Funds—Relative Value
- Private Equity
- Private Debt
|
- Hedge Funds—Event Driven
- Hedge Funds—Macro
|
intentionally blank
|
Source: Wells Fargo Investment Institute, September 29, 2025.
*Tactical horizon is 6-18 months
**Alternative investments are not appropriate for all investors. They are speculative and involve a high degree of risk that is appropriate only for those investors who have the financial sophistication and expertise to evaluate the merits and risks of an investment in a fund and for which the fund does not represent a complete investment program. Please see end of report for important definitions and disclosures.


 Sources: Bloomberg and St. Louis Federal Reserve. Quarterly data as of Q2, 2025. ERP, measured by the difference between the S&P 500 Index earnings yield (earnings/price) and the 10-year U.S. Treasury yield
 Sources: Bloomberg and Wells Fargo Investment Institute. Monthly data as of August 29, 2025. Current yields may be higher or lower than those quoted. An index is not managed and not available for direct investment. Past performance is not a guarantee of future results. This chart is for illustrative purposes only and does not constitute investment advice.
 Sources: Bloomberg and Wells Fargo Investment Institute. Data as of September 19, 2025. Start date for 5 year: September 19, 2020; Start date for 10 year: September 19, 2015; Start date for 15-year: September 19, 2010. End date for all series: September 19, 2025. An index is not managed and not available for direct investment. Past performance is not a guarantee of future results.
 Sources: Bloomberg and Wells Fargo Investment Institute. Daily data from September 1, 2020, to September 23, 2025. QTD = quarter to date. YTD = year to date. Yield to Worst (YTW) is the lowest potential yield an investor can receive on a bond without the issuer defaulting. Option-adjusted spread (OAS) is the spread relative to a risk-free interest rate. Current yields may be higher or lower than those quoted. An index is unmanaged and not available for direct investment. Past performance is no guarantee of future results.
 Sources: Bloomberg and Wells Fargo Investment Institute. Monthly spot price data per troy ounce is from January 1970 – August 2025, and indexed to 100 as of the start date of each price rally. Periods measured included January 30, 1970 – January 31, 1980, January 31, 2000 – August 31, 2011, and September 30, 2022 – August 29, 2025. Median is calculated for the first 120 months of performance for consistency across price rallies. Past performance is not a guarantee of future performance.
 Sources: Preqin and Wells Fargo Investment Institute. Data as of March 31, 2025. Private Equity – Buyout indexes include funds that report to the Preqin database that are primarily focused on purchasing at least a controlling percentage of a company's stock to take over its assets and operations. For the above chart, the delineation of Buyout sub-strategies is as follows: Vintage 1992–1996; Small Buyout ≤ $200 million; Mid-sized Buyout $200 million–$500 million; and Large Buyout > $500 million. Vintage 1997–2004: Small Buyout ≤ $300 million; Mid-sized Buyout $300 million–$750 million; Large Buyout $751 million–$2 billion; and Mega Buyout > $2 billion. Vintage 2005 – present: Small Buyout ≤ $500 million; Mid-sized Buyout $500–$1.5 billion; Large Buyout $1.5 billion–$4.5 billion; and Mega Buyout > $4.5 billion.