AI still driving the bus, but capex could broaden
Business investment has remained resilient in 2025, but it has been a tale of two cities. In fact, current FactSet consensus estimates project S&P 500 Index capex — excluding the hyperscalers (the five largest providers of cloud computing capacity) — will increase 3% in 2025 (see Chart 2). Adjusted for current producer price inflation, this implies virtually no real growth in business investment. Why? Many companies appear to be responding to modest economic growth, policy uncertainty, and tariff-related cost pressures by conserving capital. Yet, the world is composed of the sum of its parts, not the median or an average. And one part of the economy continues to experience strong growth conditions while also having become a more meaningful part of the whole.
To put it another way —in a 1990 overtime win against the Cleveland Cavaliers, Michael Jordan accounted for 59% of the Chicago Bulls’ points scored. The punchline? The Bulls still won even if it came largely on the back of one player.
What end market is playing the role of Michael Jordan today? We are, of course, referencing data center and its adjacent end markets. As a group, according to FactSet consensus estimates, the hyperscalers are expected to deliver 51% capex growth this year. This activity has in turn been highly supportive of S&P 500 Index earnings and even overall economic growth.
Chart 1. Data center, electric power, and electronics manufacturing as a percentage of non-residential construction spending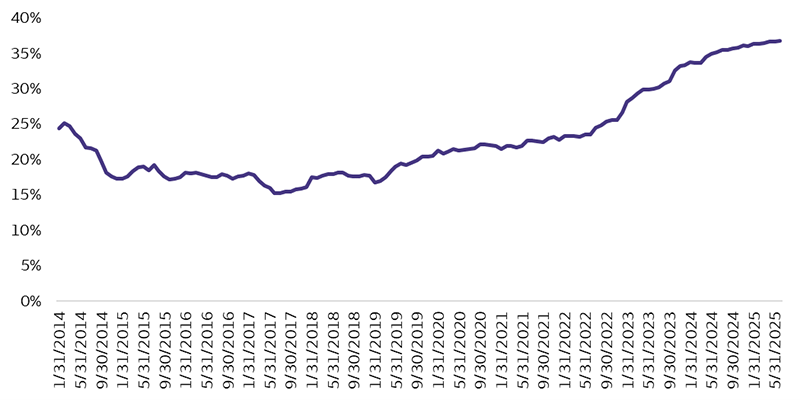
Sources: Census Bureau and Wells Fargo Investment Institute. Data through August 2025.
Many are now familiar with the areas benefiting the most from this investment, notably tech hardware and power generation. What may still be underappreciated by some investors is the potential spillover impact on less directly impacted end markets. These include steel, cement, water infrastructure, equipment rental, industrial distribution, construction equipment, and severe-service trucks. All of these areas form the backbone of the broader industrial economy and could see growing contributions from data center capex as this end market mushrooms in size.
Meanwhile, full expensing of capital equipment and research and development (R&D) expenditures, along with favorable changes to the taxable treatment of interest expense and foreign income, are all supportive of lowering after-tax hurdle rates for incremental capital spending. According to our analysis, we estimate that the median firm2 in the S&P 500 Index could see a 5% – 6% annualized benefit to free cash flow (cash from operations less capex) from the capex and R&D expensing provisions of the OBBBA (One Big Beautiful Bill Act) alone. In particular, we see a potential benefit for short-cycle and lower-cash-margin businesses where meaningful cash tax incentives can be highly stimulative of an incrementally shorter trade cycle for customers. Many of the end markets that we believe have these characteristics (trucking, construction, and agriculture) are currently depressed.
The right combination of catalysts — animal spirits, fiscal policy, interest-rate levels, broader economic growth — is typically required to drive a rebound here as these are mature industries. To this point, in addition to favorable tax policy, these businesses could also begin to benefit from interest-rate cuts in the coming months. Thus, we do believe that following a mixed year in 2025, the odds are rising that favorable tax policy could help drive stronger activity in more places in 2026.
Chart 2. S&P 500 Index capital expenditures* year-over-year change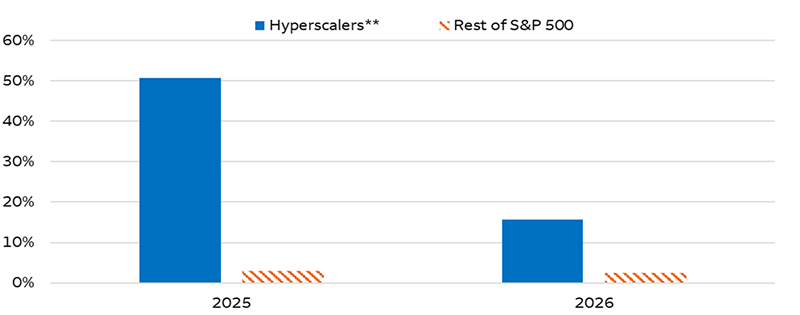
Sources: FactSet and Wells Fargo Investment Institute. *Full data set reflects companies with data available for the entirety of the 2024-2026 period; 2024 is used as the comparison year for 2025; 2025-2026 based on consensus estimates. **Hyperscalers includes: Alphabet Inc., Meta Platforms Inc, Microsoft Corporation, Amazon.com, Inc., and Oracle Corporation. Data as of September 2025. An index is unmanaged and not available for direct investment.
Our conclusion is that while one of the key stories of 2025 has been that artificial-intelligence-oriented (AI-oriented) capex has overcome weakness in other parts of the economy, 2026 could see this strength broaden at the margin, particularly in the United States. We still expect data center capex to be a key theme, but we also believe that the potential for improving activity in other areas may not be as fully anticipated or priced in. So, we see less of an “either” environment and more of an “and” environment. We believe AI investment and broader economic momentum are supportive of our favorable guidance on the Information Technology, Utilities, Financials, and Industrials sectors.
2 The median of the change for all companies in the index for which we have data.
Fundamentals signal caution in long-term Treasuries
Following the Federal Reserve’s (Fed’s) September rate cut, 10-year U.S. Treasury yields find themselves in a difficult position. The consensus based on futures market pricing suggests that short-term interest rates will fall, while we expect other components of 10-year Treasury yields — like inflation expectations and the term premium, which is the additional yield investors demand for holding long-term over short-term bonds — to remain anchored or to rise. As we expect to see a moderate U.S. economic recovery gather momentum beyond the first quarter of 2026, real (inflation-adjusted) rates could also move higher. Therefore, current 10-year yield levels appear to us to be disconnected from the yield levels implied by fundamentals.
The chart below shows two key components of 10-year yields that demonstrate this mismatch with inflation expectations remaining elevated and term premium still higher from early-2025 levels. Notably, term premium remains well below its 50-year average of 1.65%, and we believe concerns like debt sustainability issues may drive it higher in the future. This mismatch may be reasonable in periods of significant demand for Treasury securities, but with stock indexes near all-time highs and no recession in our economic outlook, it is hard to consider it warranted. Additionally, increased Treasury issuance to fund new debt required by the passage of the OBBBA and continued concerns on debt sustainability should impact the supply-and-demand balance of Treasuries in the future.
Term premium and inflation expectations in 2025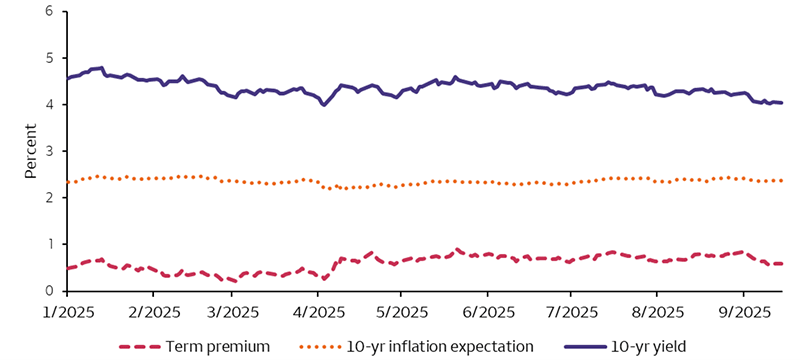
Sources: Bloomberg and Wells Fargo Investment Institute as of September 15, 2025. 10-year inflation expectations measured by the U.S. 10-year breakeven inflation rates. Term premium measured by the Adrian Crump & Moench 10-year Treasury term premium. 10-year yield measured by the generic yield on U.S. 10-year Treasury Notes.
We see this mismatch between implied and realized values for 10-year U.S. Treasury yields as a negative for long-term Treasuries — as it indicates both that investors are not being properly compensated for the risks and that Treasury yields may have difficulty falling below current levels. We remain unfavorable on Long Term Taxable U.S. Fixed Income as a result, favoring instead Intermediate Term Taxable U.S. Fixed income as a better balance of risk and yields.
Copper: Focus on signal over noise
Copper’s sensitivity to global growth means increased price volatility, especially during times of economic uncertainty. This year has brought the added challenge of fluctuating trade policy. The chart below illustrates the run-up in July 2025 following the announcement of a significant copper tariff, which was subsequently reversed in August when the policy was revised to exclude refined copper. We believe these sharp moves serve as a distraction from the broader price trend, which is clearly higher from the lower left to the upper right, and mirrors the uptrend in global demand for copper.
Our reasoning for continued optimism around this demand comes from a possible recovery in U.S. housing, a bottoming in the Chinese economy, the build-out of AI data centers, and the related increase in power generation needs. U.S. housing should rebound as the Fed cuts interest rates, which might make home ownership more affordable and spur construction. With respect to China, a focus on supporting the domestic economy — which relies heavily on manufacturing — to offset the headwinds from global trade protectionism should increase demand for industrial metals. Lastly, AI has been a game-changer with respect to the building of data centers and the power needed to run them, both of which require the usage of copper and industrial metals.
We recently upgraded the Industrial Metals sector within Commodities. This is largely due to the critical roles they play in many of the major technologies being developed today while retaining all their traditional industrial uses. We prefer investors take advantage of pullbacks during times of economic uncertainty to add exposure to the sector.
Copper remains in an uptrend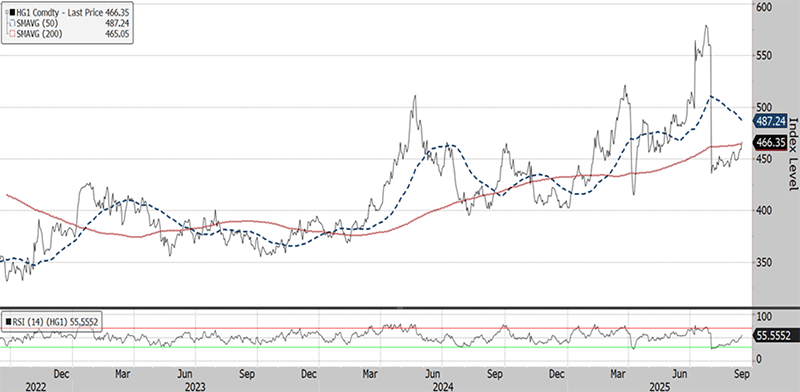
Sources: Bloomberg and Wells Fargo Investment Institute. Daily data from September 15, 2022 through September 15, 2025. HG1 = Generic 1st copper contract on the COMEX (the Commodity Exchange). SMAVG (50) = 50-day simple moving average. SMAVG (200) = 200-day simple moving average. RSI = relative strength index. An index is unmanaged and not available for direct investment.
Past performance is no guarantee of future results.
Secondaries go mainstream
The secondary transactions in private capital – where investors sell existing fund commitments to others – have evolved into an increasingly important method that fund managers and investors use to generate distributions.
In the first half of 2025, global secondaries transaction volume surpassed $100 billion, marking the strongest half-year on record (see chart below). This growth is notable given the broader slowdown in private markets, where fundraising and exit activities have been constrained by elevated interest rates, inflation, economic concerns, and policy uncertainties.
According to Pitchbook3, fundraising for Secondaries sub-strategies is also on pace to exceed 2024’s record, supported by growing interest from both institutional and wealth-management investors. Additionally, secondaries market pricing has remained stable, hovering near historical averages across most strategies.3
We believe this momentum reflects a broader trend: both qualified investors and fund managers are increasingly turning to the secondaries market to generate distributions and to actively manage their holdings in a shifting macro environment.
While Private Equity Secondaries still leads the space by assets under management, Secondaries sub-strategies have expanded into Private Real Estate and Private Debt, signaling broader adoption across asset classes, according to Pitchbook data.3 Compared to primary private-capital strategies, we believe Secondaries sub-strategies have the potential to offer diversified exposure across industries and managers; improved visibility of underlying holdings; and potential discounts on entry pricing.
As qualified investors continue to seek diversification, we believe Secondaries sub-strategies will continue to grow.
Secondaries transaction volume surpassed $100 billion in the first half of 2025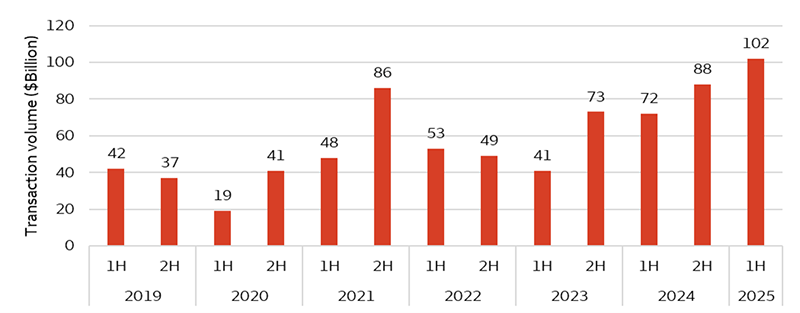
Sources: Pitchbook, Evercore, and Wells Fargo Investment Institute. Data as of June 30, 2025. 1H: first half; 2H: second half.
Past performance is no guarantee of future results.
Alternative investments, such as hedge funds, private equity, private debt and private real estate funds are not appropriate for all investors and are only open to “accredited” or “qualified” investors within the meaning of U.S. securities laws.
3 Pitchbook Q3 (third quarter) 2025 Quantitative Perspectives US Market Insights, August 31, 2025.
Cash Alternatives and Fixed Income
| Most Unfavorable |
Unfavorable |
Neutral |
Favorable |
Most Favorable |
|
intentionally blank
|
- U.S. Long Term Taxable Fixed Income
- U.S. Short Term Taxable Fixed Income
|
- Cash Alternatives
- Developed Market Ex-U.S. Fixed Income
- Emerging Market Fixed Income
- High Yield Taxable Fixed Income
|
intentionally blank
|
- U.S. Intermediate Term Taxable Fixed Income
|
Equities
| Most Unfavorable |
Unfavorable |
Neutral |
Favorable |
Most Favorable |
|
intentionally blank
|
- Emerging Market Equities
- U.S. Small Cap Equities
|
- Developed Market Ex-U.S. Equities
|
- U.S. Large Cap Equities
- U.S. Mid Cap Equities
|
intentionally blank
|
Real Assets
| Most Unfavorable |
Unfavorable |
Neutral |
Favorable |
Most Favorable |
|
intentionally blank
|
intentionally blank
|
- Commodities
- Private Real Estate
|
intentionally blank
|
intentionally blank
|
Alternative Investments**
| Most Unfavorable |
Unfavorable |
Neutral |
Favorable |
Most Favorable |
|
intentionally blank
|
intentionally blank
|
- Hedge Funds—Equity Hedge
- Hedge Funds—Relative Value
- Private Equity
- Private Debt
|
- Hedge Funds—Event Driven
- Hedge Funds—Macro
|
intentionally blank
|
Source: Wells Fargo Investment Institute, September 22, 2025.
*Tactical horizon is 6-18 months
**Alternative investments are not appropriate for all investors. They are speculative and involve a high degree of risk that is appropriate only for those investors who have the financial sophistication and expertise to evaluate the merits and risks of an investment in a fund and for which the fund does not represent a complete investment program. Please see end of report for important definitions and disclosures.


 Sources: Census Bureau and Wells Fargo Investment Institute. Data through August 2025.
 Sources: FactSet and Wells Fargo Investment Institute. *Full data set reflects companies with data available for the entirety of the 2024-2026 period; 2024 is used as the comparison year for 2025; 2025-2026 based on consensus estimates. **Hyperscalers includes: Alphabet Inc., Meta Platforms Inc, Microsoft Corporation, Amazon.com, Inc., and Oracle Corporation. Data as of September 2025. An index is unmanaged and not available for direct investment.
 Sources: Bloomberg and Wells Fargo Investment Institute as of September 15, 2025. 10-year inflation expectations measured by the U.S. 10-year breakeven inflation rates. Term premium measured by the Adrian Crump & Moench 10-year Treasury term premium. 10-year yield measured by the generic yield on U.S. 10-year Treasury Notes.
 Sources: Bloomberg and Wells Fargo Investment Institute. Daily data from September 15, 2022 through September 15, 2025. HG1 = Generic 1st copper contract on the COMEX (the Commodity Exchange). SMAVG (50) = 50-day simple moving average. SMAVG (200) = 200-day simple moving average. RSI = relative strength index. An index is unmanaged and not available for direct investment. Past performance is no guarantee of future results.
 Sources: Pitchbook, Evercore, and Wells Fargo Investment Institute. Data as of June 30, 2025. 1H: first half; 2H: second half. Past performance is no guarantee of future results.