The recovery advantage — How diversifiers help deliver
Earlier this month, we advised investors to consider reducing portfolio risk by reallocating from equities into fixed income, anticipating volatility driven by prolonged tariff implementation and slowing economic growth.1 While that shift remains relevant, it’s only part of the solution.
Diversification can provide additional layers of protection and resilience by seeking to reduce risk. Diversifiers like Commodities and alternative investments (for example, hedge funds and private capital) behave differently from stocks and bonds, potentially helping portfolios weather market downturns more effectively. These diversifiers may enhance an investment return and provide the potential for reduced downside exposure compared to allocations that include only stocks and bonds.
Compared to an allocation including only equities, the inclusion of bonds historically has benefited investors by lessening drawdowns and speeding up recovery time (see 60% S&P 500 Index/40% Bloomberg U.S. Aggregate Bond Index in Table 1). Including additional layers of diversification historically has amplified these benefits. The balanced Moderate Growth & Income (MGI) Liquid allocation that includes international assets and Commodities historically has recovered, on average, a month earlier than the less-diversified 60/40 allocation due to its slightly smaller drawdown during bear markets.
Going a step further, allocations that include alternatives have recovered faster. The MGI Illiquid allocation shaved another month off the average bear market recovery time with a smaller drawdown.
Table 1: Average bear market return and recovery
| Index or allocation |
Average peak to trough return |
Months to recover |
| S&P 500 Index |
-36.75% |
40.7 |
| 60% S&P 500 Index/40% Bloomberg U.S. Aggregate Bond Index (rebalanced quarterly) |
-22.26% |
23.2 |
| MGI Liquid (rebalanced quarterly) |
-21.52% |
22.4 |
| MGI Illiquid (rebalanced quarterly) |
-18.81% |
21.1 |
Sources: © Morningstar Direct, All Rights Reserved,
2 Wells Fargo Investment Institute, as of August 19, 2025. MGI = Moderate Growth & Income.
Index return information is provided for illustrative purposes only. Performance results for MGI Liquid and Illiquid are calculated using blended index returns. Results do not represent actual trading and the results achieved do not represent the experience of any individual investor. In addition, results do not reflect the impact of any fees, expenses or taxes applicable to an actual investment. An index is unmanaged and not available for direct investment.
Past performance does not guarantee future results. The MGI Liquid and Illiquid compositions and the definitions of the indexes and descriptions of the risks associated with investment in these asset classes are provided on pages 9 and 10. Dates of drawdowns align with the following S&P 500 Index bear markets: January 11, 1973–October 3, 1973, November 28, 1980–August 12, 1982, August 25, 1987–December 4, 1987, July 16, 1990–October 11, 1990, March 24, 2000–October 9, 2002, October 9, 2007–March 9, 2009, February 19, 2020–March 23, 2020, and January 3, 2022–October 12, 2022.
The most recent market correction reaffirmed this pattern. Table 2 shows that despite the swift nature of the tariff-induced downturn earlier this year, diversified allocations still recovered faster and experienced smaller losses. Notably, the MGI allocation’s international exposure played a key role in outperforming the U.S.-centric 60/40 allocation.
Table 2: Most recent U.S. stock market correction (Feb. 19, 2025, through April 8, 2025)
| Index or allocation |
Peak to trough return |
Months to recover |
| S&P 500 Index |
-18.90% |
4.2 |
| 60% S&P 500 Index/40% Bloomberg U.S. Aggregate Bond Index (rebalanced quarterly) |
-11.18% |
3.7 |
| MGI Liquid (rebalanced quarterly) |
-9.48% |
3.5 |
Sources: © Morningstar Direct, All Rights Reserved,
3 Wells Fargo Investment Institute, as of August 19, 2025. MGI = Moderate Growth & Income.
Index return information is provided for illustrative purposes only. Performance results for MGI Liquid are calculated using blended index returns. Due to the data lag for private capital, data for MGI Illiquid is not available for this analysis. Results do not represent actual trading and the results achieved do not represent the experience of any individual investor. In addition, results do not reflect the impact of any fees, expenses or taxes applicable to an actual investment. An index is unmanaged and not available for direct investment.
Past performance does not guarantee future results. The MGI Liquid composition and the definitions of the indexes and descriptions of the risks associated with investment in these asset classes are provided on pages 9 and 10.
Diversification isn’t only about the different asset groups; it’s also about having the right mixture of asset classes within them. In equities, we are favorable on U.S. Mid Cap and Large Cap Equities, which we expect to be more resilient through any upcoming volatility compared to U.S. Small Caps or international equities. In fixed income, we are most favorable on U.S. Intermediate Term Taxable Fixed Income. As the economy slows and as risks emerge on the short- and long-term ends of the yield curve, we view intermediate term as a place to both potentially lock in attractive yield and reduce exposure to risks that may impact the two ends of the yield curve.
While we also recently reduced our tactical allocation to Commodities, we still favor a neutral allocation in line with our strategic long-term guidance. We think commodities should still prove to be a useful tool as a diversifier as they typically have not moved in the same direction as either stocks or bonds. And lastly, for qualified investors, we expect alternative investments to continue to benefit from the current market and economic environment. We favor selected Event Driven and Macro hedge fund strategies and continue to view Private Equity and Private Debt as avenues to provide differentiated sources of return outside traditional markets.
As markets remain unpredictable, the case for diversification grows stronger in our view. Beyond a simple 60/40 allocation, incorporating international assets, Commodities, and alternatives can offer investors the potential to reduce risk, recover faster, and stay on course toward long-term goals.
1 Wells Fargo Investment Institute, “Adjusting portfolio guidance and allocations,” August 5, 2025.
2 The information contained herein: (1) is proprietary to Morningstar and/or its content providers; (2) may not be copied or distributed; and (3) is not warranted to be accurate, complete or timely. Neither Morningstar nor its content providers are responsible for any damages or losses arising from any use of this information.
3 The information contained herein: (1) is proprietary to Morningstar and/or its content providers; (2) may not be copied or distributed; and (3) is not warranted to be accurate, complete or timely. Neither Morningstar nor its content providers are responsible for any damages or losses arising from any use of this information.
Second-quarter earnings: AI driven beats
call out “You will never win if you never begin”
— Helen Rowland end call out
With 95% of the S&P 500 Index companies having already reported, we are nearing the end of the second-quarter earnings season. What have been some of the key observations?
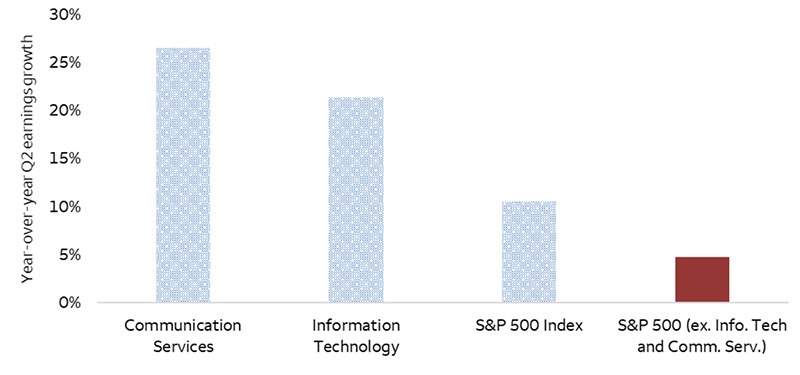
By nearly all measures, the second-quarter earnings season has smashed consensus expectations. Prior to the start of the earnings season, the consensus expectation reported by Bloomberg for quarter two S&P 500 Index earnings per share (EPS) year-over-year growth was less than 3%. As of August 20, the index is tracking to 11% earnings growth. Similar upside surprises were observed for sales and margin expectations. So far, roughly 82% of companies have beat earnings expectations, which is the highest level in years and well above the long-term average of 74%.
Data reveals these impressive numbers are largely due to the two heavyweight sectors — Communication Services and Information Technology. Each has had a stellar season, and both are tracking to grow earnings by over 20%, which has been driven in large part by the massive AI buildout. Due to their weighting within the S&P 500 Index being roughly 45%, these two sectors significantly influence index statistics. Stripping out these companies from the index would cut the 11% earnings growth rate to less than 5% (see chart).
This AI theme drove second-quarter earnings growth and is a key reason why the season surprised to the upside. We forecast this trend to moderate but continue in the coming quarters as the AI cycle matures. We recently trimmed gains in Communication Services by downgrading it to neutral and remain favorable on Information Technology as well as U.S. Large Cap Equities. We would likely view meaningful pullbacks as opportunities to add exposure up to recommended weights.
AI sectors dominate second-quarter earnings growth
Sources: Bloomberg and Wells Fargo Investment Institute. Data as of August 18, 2025.
Past performance does not guarantee future results.
Futures markets expect a September rate cut
Last year, the Fed was able to deliver a 50 bps (bp; a basis point is 1/100 of a percentage point) cut to moderate rates on the belief that inflation was getting under control. This year, the trend of inflation is not so clear. We acknowledge that weakening job growth is making a September rate cut more likely. What's more today's unemployment rate of 4.2% is historically low, and the threat of tariff-induced inflation remains in the coming months. We would caution that these considerations may make policy makers hesitate to cut rates aggressively.
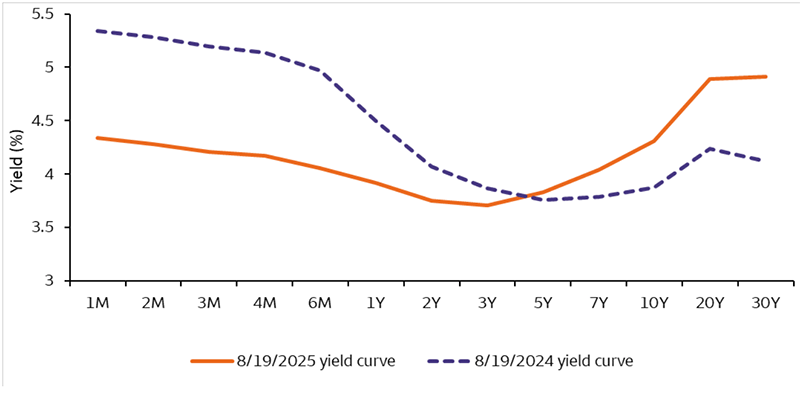
The Fed’s dual mandate of employment and price stability means that a September cut is not a guarantee, and our target remains for a single 25 bps cut in 2025, though we believe the risks to the upside have risen. A 50-bps cut in September would run counter to the Fed’s data dependent cautious approach. Even if the possible Fed cut and short-term rates decline, we do not believe that long-term rates would necessarily fall. The chart shows the yield curve before the Fed delivered the August 19, 2024, cuts versus August 19, 2025. Even though yields on the shorter end of the curve fell, yields on the longer end rose.
Analysis of the current U. S Treasury yield curve and pre-2024 Fed cut structure
Sources: Bloomberg and Wells Fargo Investment Institute as of August 19, 2025. Yields represent past performance and fluctuate with market conditions. Current yields may be higher or lower than those quoted above.
Past performance is no guarantee of future results.
While a super-sized cut seems unlikely now, we still believe that short rates will be on a downtrend. We favor deploying large cash holdings before short-term rates fall. We are most favorable on U.S. Intermediate Term Taxable Fixed Income, as we believe it will benefit from any rate cuts while allowing investors to potentially lock in higher yields for the upcoming years.
Seasonal oil strengths set to fade
Crude oil prices have held up relatively well, averaging $67 per barrel year to date (as of 8/19), despite mounting concerns of slower global demand growth from tariffs and robust OPEC+4 supply.
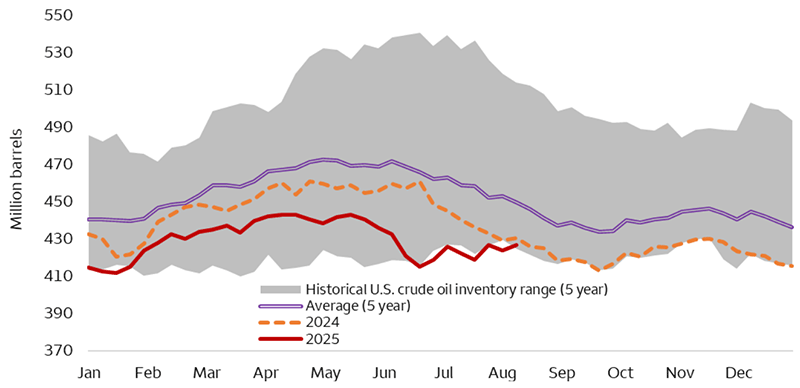
Periods of escalating tensions in the Middle East rapidly drove prices higher for a short period, but strong seasonal trends have also been an important tailwind. As seen in the chart, crude oil inventories typically follow seasonal patterns in response to changes in demand and refining activity. During weaker demand periods, such as the spring or fall, ample supply and growing inventories become a headwind for prices. However, as demand strengthens through the summer months inventories are drawn down to meet the heightened demand and prices typically rise.
Today, we are near the end of the summer and still experiencing strong seasonals, as declining U.S. rig counts and above average crude oil demand5 have drawn down inventories well below the five-year seasonal average (see chart). However, these strong tailwinds will likely fade in the coming months as we approach the fall and seasonal demand weakens. Additionally, OPEC+ supply growth will be a major contributor to the expected surplus through year end.
The bottom line is that we expect the strong seasonal tailwinds to fade in the coming months as demand weakens and excess supply begins to show up in growing inventories. Unless disrupted by a supply shock or unexpected demand surge, we expect that crude oil prices are likely to stay rangebound in the coming months. We remain neutral on Energy sector commodities and prefer sectors with a stronger outlook such as Industrial Metals or Precious Metals.
Seasonality of U.S. crude oil inventories
Sources: Bloomberg, Wells Fargo Investment Institute and Energy Information Administration. Weekly data is from January 7, 2020 – August 12, 2025.
4 The organization of the petroleum exporting countries (OPEC) is a coalition that aims to coordinate oil production and influence global prices. The group was expanded in 2016 to form OPEC+.
5 Energy Information Administration, Product Supplied four-week average relative to five-year seasonal average.
Strategic allocations added to private capital
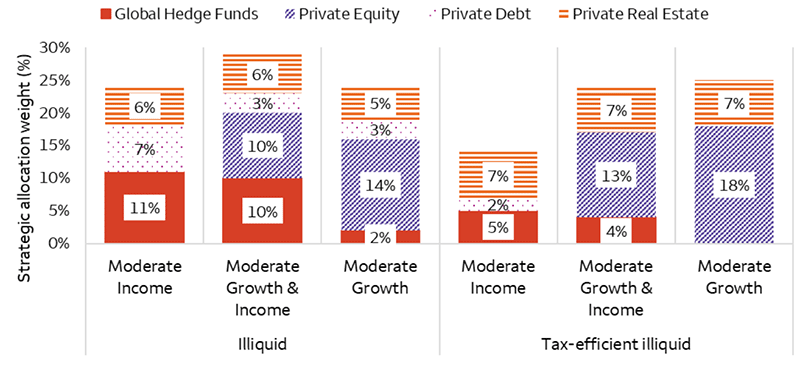
In the annual update released on July 16, our illiquid strategic allocations, which allocate across public and private markets, increased the weight of Private Debt in Income objectives by 2%, from 3% to 5%. Further, tax-efficient illiquid strategic allocations, which are designed for tax-sensitive investors, also added 2% to Private Equity in Growth & Income and Growth objectives (chart below).
These changes were made in part to reflect the expanding investment opportunity set available in private markets, as well as the growing number of new strategies and product options introduced in recent years.
The number of companies owned by private-equity funds has grown over fifteen-fold from 1996 to 2024 based on Pitchbook data. During the same time, publicly listed U.S. companies have declined in number from 8,090 to 4,623 according to the World Bank. With its growing opportunity set, we believe incorporating Private Equity into traditional stock and bond portfolios can enhance return potential.
A similar story took place in the loan markets, where over the past two decades, traditional corporate lenders—commercial banks—have declined in number due to industry consolidation and changing regulations. To help the demand for Private Debt, an increasing number of asset managers began to offer bespoke, directly originated loans. According to Cliffwater, direct loans generated attractive yields between 2005 and 2024.
We believe qualified investors who are comfortable with the limited liquidity, transparency, and additional complexity in private capital should consider Wells Fargo Investment Institute’s (WFII’s) illiquid strategic allocations when developing their long-term portfolios.
WFII’s 2025 illiquid strategic allocations increased exposure to Private Debt and Private Equity
Sources: Wells Fargo Investment Institute. Data as of July 24, 2025. Moderate objectives are shown for illustration purposes.
Alternative investments, such as hedge funds, private equity, private debt and private real estate funds are not appropriate for all investors and are only open to “accredited” or “qualified” investors within the meaning of U.S. securities laws.
Cash Alternatives and Fixed Income
| Most Unfavorable |
Unfavorable |
Neutral |
Favorable |
Most Favorable |
|
intentionally blank
|
- U.S. Long Term Taxable Fixed Income
- U.S. Short Term Taxable Fixed Income
|
- Cash Alternatives
- Developed Market Ex-U.S. Fixed Income
- Emerging Market Fixed Income
- High Yield Taxable Fixed Income
|
intentionally blank
|
- U.S. Intermediate Term Taxable Fixed Income
|
Equities
| Most Unfavorable |
Unfavorable |
Neutral |
Favorable |
Most Favorable |
|
intentionally blank
|
- Emerging Market Equities
- U.S. Small Cap Equities
|
- Developed Market Ex-U.S. Equities
|
- U.S. Large Cap Equities
- U.S. Mid Cap Equities
|
intentionally blank
|
Real Assets
| Most Unfavorable |
Unfavorable |
Neutral |
Favorable |
Most Favorable |
|
intentionally blank
|
intentionally blank
|
- Commodities
- Private Real Estate
|
intentionally blank
|
intentionally blank
|
Alternative Investments**
| Most Unfavorable |
Unfavorable |
Neutral |
Favorable |
Most Favorable |
|
intentionally blank
|
intentionally blank
|
- Hedge Funds—Equity Hedge
- Hedge Funds—Relative Value
- Private Equity
- Private Debt
|
- Hedge Funds—Event Driven
- Hedge Funds—Macro
|
intentionally blank
|
Source: Wells Fargo Investment Institute, August 25, 2025.
*Tactical horizon is 6-18 months
**Alternative investments are not appropriate for all investors. They are speculative and involve a high degree of risk that is appropriate only for those investors who have the financial sophistication and expertise to evaluate the merits and risks of an investment in a fund and for which the fund does not represent a complete investment program. Please see end of report for important definitions and disclosures.


 Sources: Bloomberg and Wells Fargo Investment Institute. Data as of August 18, 2025. Past performance does not guarantee future results.
 Sources: Bloomberg and Wells Fargo Investment Institute as of August 19, 2025. Yields represent past performance and fluctuate with market conditions. Current yields may be higher or lower than those quoted above. Past performance is no guarantee of future results.
 Sources: Bloomberg, Wells Fargo Investment Institute and Energy Information Administration. Weekly data is from January 7, 2020 – August 12, 2025.
 Sources: Wells Fargo Investment Institute. Data as of July 24, 2025. Moderate objectives are shown for illustration purposes.