



September 3, 2026
Gary Schlossberg, Global Macro Strategist
Awsaf Tamjid Arko, Global Equity Strategy Associate
Jennifer Timmerman, Global Macro Analyst
Harsh Agarwal, Global Strategy Associate
Can AI help pay America’s bills?
Key takeaways
- History shows that major technological change can boost productivity, economic growth, and tax revenues, improving the long-term sustainability of government debt.
- In our view, generative artificial intelligence (AI) has the potential to deliver the most significant productivity gains since the railroad buildout of the 19th century, creating a historic opportunity to strengthen the U.S. fiscal outlook.
What it may mean for investors
- While AI alone may not solve America’s fiscal challenges, we believe AI-related productivity growth can help offset fiscal concerns, reinforcing the important role of high-quality, long-term fixed income in diversified investment portfolios.
It has been said that the 19th-century railroad buildout was the centerpiece of U.S. economic history in the 19th century.1 Today, AI-related capital investment as a share of total economic output is already the largest and potentially most consequential technology development since the railroad buildout (see Chart 1).2
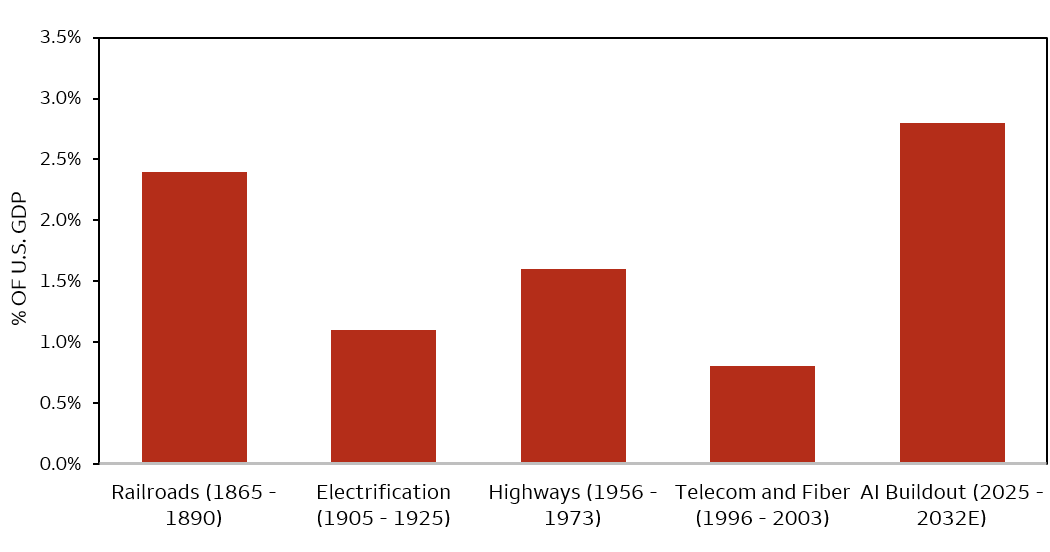 Sources: Wells Fargo Investment Institute and Stijn Van Nieuwerburgh, "Financing the AI Buildout," Columbia Business School working paper (2026). Data as of August 28, 2026. AI = Artificial intelligence. GDP = gross domestic product. E = Estimate. Historical figures are academic estimates and subject to revision; the AI buildout (2025–2032E) is a projection and not guaranteed, though we currently view this as a conservative estimate that could reach nearly 4% of GDP.
AI is the main driver of an investment boom that, by our estimate, now accounts for more than 40% of economic growth, up from a long-term (30-year) norm of little more than 20% in the period before generative AI’s introduction in 2022.3 Our view is that the scope and nature of AI offer a unique opportunity for a material and enduring boost to capital spending. This new technology also can encourage changes to business practices that foster stronger productivity, economic, wage, and profit growth, which could materially improve U.S. government finances over time.
From railroads to AI: Revolutionary innovation
Most basically, we can think of productivity as efficiency. Productivity is the value of goods and services that a worker can produce over a given period, often with the help of machinery and technology. Productivity growth occurs when workers and the tools they use produce more output without a proportional increase in labor or equipment costs. In this way, productivity growth typically boosts profits initially and, over time, creates room for higher wages. As profits and wages rise, so does the portion that becomes government tax revenue.
More precisely, technological changes increase multifactor productivity4 by improving the efficiency in how labor, machines, and other inputs work together. AI holds promise not only as a tool that could make machines, software, and human labor more efficient, but it also can help managers design more efficient production processes that add to multifactor productivity. For example, factories started using electricity in 1883, but productivity growth rose again once managers developed the electricity-powered moving assembly line in the 1910s.5
Furthermore, history shows a strong link between major technological and infrastructure investments, multifactor productivity growth, and economic expansion. Evidence of the link between accelerated productivity growth, successful technology adoption, and infrastructure investment is apparent in investment and productivity booms throughout the past 75 years:
- In the 1950s, businesses absorbed wartime technologies while investments, such as the interstate highway system, improved economic efficiency.
- In the 1960s, rapid innovation in electronics and aerospace supported productivity gains alongside strong capital investment.
- During the late 1990s, the commercialization of the internet and broader adoption of digital technologies contributed to one of the strongest productivity accelerations in modern history.
Even more striking was the railroad boom of the late 19th century. The first transcontinental railroad opened in 18696 and connected to the many regional rail networks that had developed before and after the Civil War. The new rail networks certainly slashed the cost of moving goods and people but also cut the cost of sharing and using information. The growth of the railroads made it easy to extend the telegraph wires across the country. In fact, The Pacific Railway Act of 1862 provided land grants to build the railroads, but on the condition that telegraph lines be built alongside the railroad tracks.7
Once transportation and communication across communities became so much faster and easier, the new ideas multiplied. To illustrate, the number of patents surged: The U.S. issued 41 patents in 1800, 4,363 in 1860, and 25,308 in 1890.8 That translated to 64 patents for every $1,000 of inflation-adjusted gross domestic product (real GDP) in 1890 from nearly 44 patents in 1860 and fewer than 5 per $1,000 of real GDP in 1800. Patent growth accelerated most dramatically in regions newly connected by rail, suggesting that communities across the country found new ways to learn how to improve their local economies.9 In turn, this was one of the most dynamic periods of income growth in U.S. economic history. The combination of a growing population and rapid productivity improvement made 1840-1890 the 50-year period with the fastest rate of growth of income per capita in U.S. history, at least so far.10
Fast-forward to today, and the timing, magnitude, and persistence of economic gains from AI likely will depend on the pace of business adoption, which we expect to remain rapid. However, we also believe AI could be equally transformative for how people, machines, and business managers use information to lower the costs of producing goods and services. Generative AI appears particularly promising because it can be adopted quickly and applied across a wide range of industries and business functions. Unlike many past innovations that required extensive physical infrastructure, AI systems can improve rapidly through advances in computing power, data, and model development. As a result, AI has the potential to deliver lasting gains in productivity, economic growth, and federal revenues by helping workers perform tasks more efficiently and increasing multifactor productivity.
The potential fiscal benefits of productivity growth
Faster productivity and economic growth can also boost federal revenues, reduce deficits, and enhance the economy's capacity to sustain government debt. Since 1943, economic growth and federal revenues have tended to rise and fall together, with a correlation of 90%.11 Productivity growth has also helped generate higher revenues, though the relationship has been less pronounced, but still meaningful at 60%.
Congress always has the choice to use the fiscal windfall to improve the budget outlook or to increase spending and further worsen long-term deficits. Indeed, the budgetary benefits of strong productivity growth during the 1950s, 1960s, and 1980s were partly offset by tax policy changes and higher spending. However, the late 1990s demonstrate that sustained productivity gains can meaningfully improve the fiscal outlook, even contributing to federal budget surpluses.
During that decade, productivity gains associated with the internet and the widespread adoption of personal computers coincided with fiscal restraint and lower defense spending following the end of the Cold War. Together, these forces strengthened the budget outlook and helped generate federal budget surpluses from fiscal years 1998 through 2001.12 Technological improvements provided Congress with an incentive to make needed policy changes. Today, our expectation for even stronger productivity growth than in the 1990s creates a similar opportunity for Congress to significantly narrow the federal deficit and potentially reduce public debt as a share of the economy.
Looking ahead, the nonpartisan Congressional Budget Office (CBO) estimates that a sustained 0.5% increase in productivity growth could significantly improve the federal budget outlook. Over the next decade, stronger productivity gains could lift economic growth and steadily increase federal tax revenues by more than the CBO’s baseline forecast. By the 10th year, the projection with productivity growth would put annual revenues approximately $625 billion higher than the baseline, or about 2% of GDP (see Chart 2). For context, that figure is equivalent to a tax change roughly twice the size that we would typically consider large enough to materially influence economic growth.
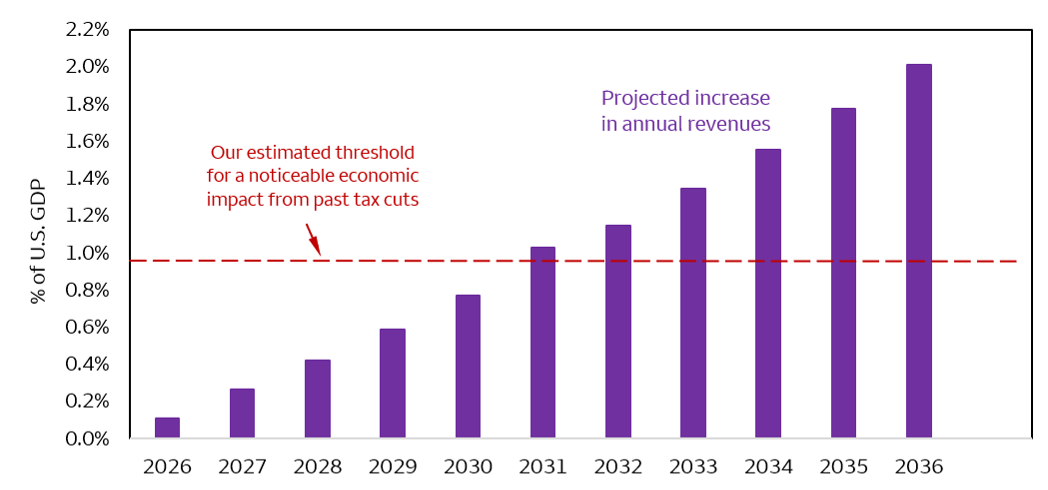 Sources: Wells Fargo Investment Institute and Congressional Budget Office (CBO). GDP = gross domestic product. Data as of August 28, 2026. *Projected annual revenue increases with a half percentage point increase in yearly productivity growth.
Thus, stronger economic growth may improve debt sustainability in two ways. First, higher revenues could reduce budget deficits and slow the accumulation of debt. Second, a larger economy increases the resources available to support that debt, lowering the existing debt burden relative to the size of the economy.13 The CBO estimates that reduced budget deficits from only a 0.5% increase in economic growth tied to a similar increase in productivity gains — both conservative estimates, in our view — would limit the rise of federal debt from 99% of GDP in 2025 to less than 110% of GDP a decade from now, compared to just over 120% in its baseline forecast (see Chart 3).
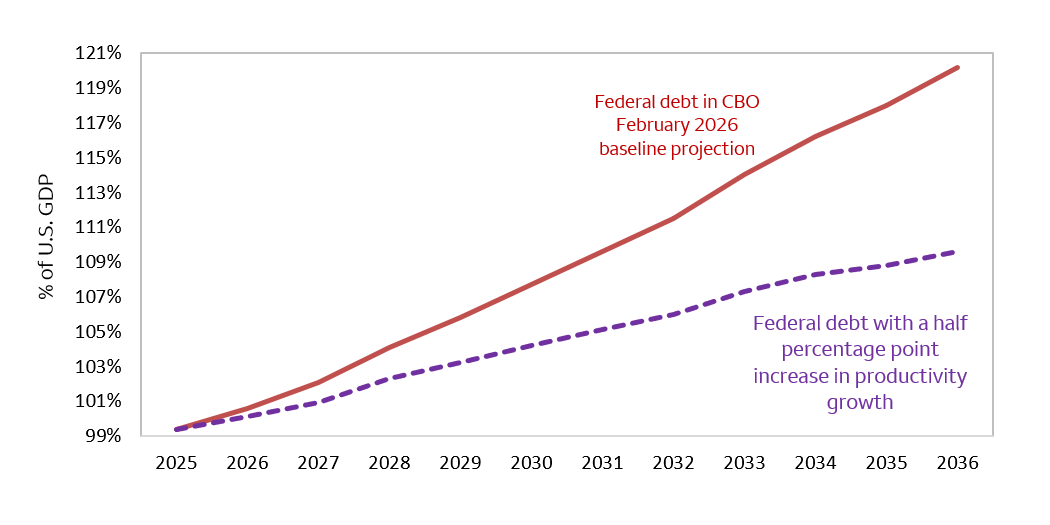 Sources: Wells Fargo Investment Institute and Congressional Budget Office (CBO). GDP = gross domestic product. Data as of August 28, 2026. *Projected annual debt with a half percentage point increase in yearly productivity growth.
A historic opportunity for Congress
This is a moment when legitimate investor concerns about U.S. deficits and debt intersect with a potentially historic opportunity for stronger productivity growth. The CBO's estimates suggest that even modest gains in productivity, such as those that could emerge from broader AI adoption, can meaningfully alter the path of federal revenues and debt. While AI will not solve America's fiscal challenges on its own, the resulting productivity gains could make difficult budget decisions less difficult and allow Congress to address those challenges from a position of greater economic strength.
We believe the long-term outlook for U.S. government debt may prove more resilient than many investors fear. The debt trajectory depends not only on what Congress spends, but also on the economy's ability to innovate, grow, and generate the income and tax revenue needed to support those obligations. In our view, this possibility reinforces the important role that high-quality, long-term fixed income can play in diversified portfolios, despite ongoing concerns about deficits and debt. In light of history, current developments suggest that investors should not underestimate the power of innovation to reshape long-term economic and financial outcomes. So, can AI's productivity gains help pay America's bills? We believe they can.
1 The observation is attributed to the 20th-century economist Joseph Schumpeter in Productivity and Technological Change in the Railroad Sector, 1840-1910 by Albert Fishlow, appearing in Output, Employment and Productivity in the United States after 1800, National Bureau of Economic Research, 1966.
2 See Meghan Bobrowski et al., “Big Tech AI Push Is Costing a Lot More Than the Moon Landing,” The Wall Street Journal, February 7, 2026.
3 Based on our analysis of Commerce Department data.
4 Multifactor productivity is a measure of the efficiency with which labor, capital, and other inputs are combined to generate output.
5 For more detail, see “The Moving Assembly Line and the Five-Dollar Workday,” Ford Motor Company, September 3, 2020.
6 History and the Census: The Transcontinental Railroad, U.S. Census Bureau, May 1, 2023.
7 The Pacific Railway Act (1862), The National Archives, August 14, 2026.
8 Research shows railroad access led to a 9%-15% increase in patents. See Shuting Li, “Information and Innovation: Evidence from Railroad Expansion in the 19th Century,” 2026.
9 Historical Patent Data Files, U.S. Patent Office, August 14, 2026.
10 Louis Johnston and Samuel H. Williamson, "What Was the U.S. GDP Then?", Measuring Worth, 2026. U.S. Bureau of Economic Analysis data 1929 to the present linked to Johnston-Williamson estimates for 1790-1928.
11 Based on our analysis of data from the Congressional Budget Office, “Historical Budget Data,” February 2026.
12 See CBO, “Historical Budget Data,” February 2026.
13 This framework mirrors a theme from our report, “Paying America’s Bills,” May 2026.
Risks Considerations
Each asset class has its own risk and return characteristics. The level of risk associated with a particular investment or asset class generally correlates with the level of return the investment or asset class might achieve. Bonds are subject to market, interest rate, price, credit/default, liquidity, inflation and other risks. Prices tend to be inversely affected by changes in interest rates.
General Disclosures
Global Investment Strategy (GIS) is a division of Wells Fargo Investment Institute, Inc. (WFII). WFII is a registered investment adviser and wholly owned subsidiary of Wells Fargo Bank, N.A., a bank affiliate of Wells Fargo & Company.
The information in this report was prepared by Global Investment Strategy. Opinions represent GIS’ opinion as of the date of this report and are for general information purposes only and are not intended to predict or guarantee the future performance of any individual security, market sector or the markets generally. GIS does not undertake to advise you of any change in its opinions or the information contained in this report. Wells Fargo & Company affiliates may issue reports or have opinions that are inconsistent with, and reach different conclusions from, this report.
The information contained herein constitutes general information and is not directed to, designed for, or individually tailored to, any particular investor or potential investor. This report is not intended to be a client-specific suitability or best interest analysis or recommendation, an offer to participate in any investment, or a recommendation to buy, hold or sell securities. Do not use this report as the sole basis for investment decisions. Do not select an asset class or investment product based on performance alone. Consider all relevant information, including your existing portfolio, investment objectives, risk tolerance, liquidity needs and investment time horizon. The material contained herein has been prepared from sources and data we believe to be reliable but we make no guarantee to its accuracy or completeness.
Wells Fargo Advisors is registered with the U.S. Securities and Exchange Commission and the Financial Industry Regulatory Authority, but is not licensed or registered with any financial services regulatory authority outside of the U.S. Non-U.S. residents who maintain U.S.-based financial services account(s) with Wells Fargo Advisors may not be afforded certain protections conferred by legislation and regulations in their country of residence in respect of any investments, investment transactions or communications made with Wells Fargo Advisors.
Wells Fargo Advisors is a trade name used by Wells Fargo Clearing Services, LLC and Wells Fargo Advisors Financial Network, LLC, Members SIPC, separate registered broker-dealers and non-bank affiliates of Wells Fargo & Company.