


June 22, 2026
Paul Christopher, CFA, Head of Global Investment Strategy
Iran war update: Between anticipation and reality
Key takeaways
- At a high level, the U.S.-Iran Memorandum of Understanding stops the war and opens the Strait of Hormuz in a first phase. The second phase provides an extendable 60-day period to negotiate the end of Iran’s nuclear weapons program and the return of its frozen financial assets.
- But the negotiations could run longer than the planned 60 days, and we caution that the two sides may revert to using their control over the Strait as negotiating leverage, with economic consequences.
What it may mean for investors
- Our current market targets expect a gradual return to pre-war commercial traffic through the Strait. Energy prices may reverse higher in the coming weeks and make consumer price inflation sticky in the balance of 2026.
- We look for refined product prices and consumer price inflation to ease in 2027, once the use of leverage creates enough economic pressure to produce compromises.
What’s in the Memorandum of Understanding?
On June 17, the U.S. released the text of a Memorandum of Understanding that the U.S. and Iran signed. At a high level, the terms call for ending the fighting in the region (including in Lebanon), opening the Strait of Hormuz fully within 30 days under joint administration of Iran and Oman, and creating a $300 billion fund for Iran’s reconstruction. A second stage of negotiations would take a 60-day (renewable) period to negotiate the timetable to deal with Iran’s enriched uranium and the release of Iran’s frozen financial assets.
Capital markets expect quickly replenished global energy supply
Capital markets found a lift in risk appetite from the progress toward reopening the Strait. Last week, the MSCI Europe, Australasia and the Far East Index, and the MSCI Emerging Markets Index rallied to erase their June losses. For the June 5-19 period, the dated Brent crude oil price (i.e., for loading within 10 days) fell by $20/barrel, the largest decline since the U.S.-Iran ceasefire began on April 8. Over those same two weeks, (i) the inflation swap market indicated an expected half-point drop in June 2027 U.S. Consumer Price Index inflation, to below its pre-war level; and (ii) the U.S. Treasury 10-year yield fell, although concerns about a possible Federal Reserve rate hike narrowed the spread over the 2-year Treasury note.
Constructive news also arrived on June 15 from Qatar, which announced that it would increase liquid natural gas production at its war-damaged plant to about 50% of capacity one month after safe Strait passage resumes, and to roughly 80% within two months.1 Also, Bloomberg and other sources report that both Kuwait and the United Arab Emirates announced that they are ready to load crude oil cargoes now. Transportation is available: Estimates of ships stuck in the Persian Gulf awaiting cargoes run from 600 (from the BBC) to 770 (CNBC).2
In the past two weeks, these expectations have accompanied falling prices in some global energy markets. Crude oil prices accelerated the drop that began with the April 8 U.S.-Iran ceasefire.3 Benchmark European and Asian natural gas prices also have slid faster since June 5.4
Two fundamental causes drive the crude oil and natural gas price reductions since April. First, the price shock at the start of the war quickly triggered restrictions on energy usage, especially in emerging economies.5 The International Energy Agency (IEA) June 2026 monthly report estimates that the measures have cut global daily oil consumption by 1-2 million barrels (roughly 1%-2% of global consumption). Second and more importantly, IEA data, as of April 30, 2026, estimated that 2025 crude oil production exceeded annual consumption by roughly 600 million barrels. That surplus was in tankers on ocean routes or topped off global strategic reserves when the war began. That was then.
When anticipation outpaces reality
We believe the problem now is that the cumulative lost global oil production exceeds 1.1 billion barrels since February 28 (using IEA daily consumption estimates) exhausted the 2025 surplus and has dipped deep into previously accumulated strategic reserves. The June 12 U.S. (latest) Energy Information Administration data (EIA) show only 20 million barrels in the 400-tank reservoir for U.S. West Texas Intermediate (WTI) crude oil at Cushing, Oklahoma.
Cushing storage is at the operational minimum to pump further oil to U.S. refineries, as EIA has noted to Reuters.6 Think of the problem this way. Someone about to take a bath turns on the faucets, but no water flows if the community’s water reservoir level has fallen below the pumps. And what’s left in the tank bottoms are sediment, water, and other impurities that refineries cannot accept, just as the bather would reject dirty water in the tub.
The oil reserve drawdown has restricted refining and run down refined product inventories with the summer driving season in full swing. The June 12 EIA data also show U.S. diesel stocks at their lowest point in 23 years, and gasoline storage 5% below year-ago levels.
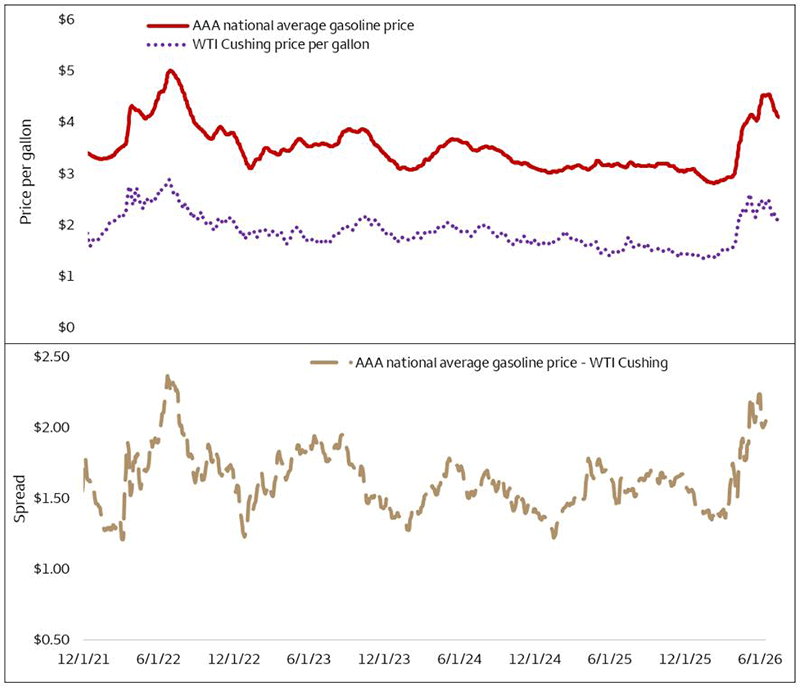
To illustrate the risk, Chart 1 compares today’s energy price spike against the 2022 version. The top panel of Chart 1 shows the U.S. WTI crude oil price and the U.S. national average gasoline price. The bottom panel plots that difference or spread. The 2022 oil and gas spikes followed U.S. and Europe sanctions on Russia’s (significant) oil and natural gas exports. Middle Eastern suppliers stepped up to replace lost Russian sales to European and Asian buyers, and so crude oil and gasoline prices spiked only briefly, illustrated by the sharply peaked top in the spread.
 Sources: Bloomberg and Wells Fargo Investment Institute. Daily data is from December 1, 2021 - June 15, 2026. A five-day average of daily data is shown in the charts above. AAA = American Association. WTI = West Texas Intermediate.
No region today can replace the net loss of roughly 14 million barrels/day Persian Gulf production. The gasoline price has fallen, in tandem with the crude oil price and an accelerated drawdown of crude oil stocks, but that may not continue. Cushing oil inventories now at their operational minimum again may widen the spread between gasoline and oil prices.
It seems to us incongruous that today’s largest crude oil supply disruption in history shows up in Chart 1, while oil and gasoline prices peak at or below those of 2022, as the chart shows. We believe this reflects that refiners have been pulling from the surplus that 2026 inherited from 2025. But that buffer is nearly gone. Whether oil and gasoline prices can stay low depends on how the U.S.-Iran negotiations proceed.
Eyes on the negotiations
Recent price action shows us that what matters to markets now is that the Strait reopens. The Memorandum of Understanding has heightened that anticipation, but the issues that have short-circuited U.S.-Iran negotiations for months remain. The latest example is the renewed fighting in Lebanon between Israel and Hezbollah, Iran’s proxy over the weekend of June 20-21. While we believe a near-term re-escalation in the war is unlikely, we see a one-in-three chance that negotiations stumble into delay that may lead both countries to apply more leverage.
We see each side’s main leverage is its ability to control traffic through a portion of the Strait. The Memorandum allows a 30-day period to fully reopen the passage, but Iran is already taking steps to create uncertainty about access. Reuters reported on June 19 that Iran had turned away two tankers on June 18 for not having Iran-issued passes. Multiple news sources reported that on June 14 an Iranian missile hit a commercial vessel transiting the Strait flying a Hong Kong flag. Iran could repeat any of these measures to maintain a sense of risk around the Strait. In fact, violence in Lebanon over the weekend of June 20-21 led Iran to close the Strait’s northern passage, through Iranian territorial waters, although the U.S. maintains a southern passage through Omani waters that remained open. For the U.S., the closest lever at hand seems to be a blockade of Iran’s ports, which the U.S. could restart. So, the recently arrived French, British, and Italian mine sweeping force has hesitated to begin its task. U.S. Central Command said on June 19 that 55 ships had crossed the Strait, but a return to the pre-war daily traffic average of 120-130 ships seems delayed.
We believe that leverage creates economic pressure that ultimately should compel another compromise that more clearly and completely reopens the Strait. That may take longer than the initial two-month period allocated in the Memorandum. Meanwhile, limited oil flows out of the Persian Gulf may push refined product prices higher and, by extension, keep consumer price inflation sticky. We look for refined product prices to ease, once daily oil production increases and eventually finds its way into storage tanks and refineries around the world.
1 “Explainer: Middle East oil and gas output will take months to fully recover,” Reuters, June 15, 2026.
2 The estimates have a range because the variety of ships include tankers and cargo ships of varying sizes.
3 As measured by cash or dated prices for the U.S. West Texas Intermediate, Brent, and Dubai dated crude oil.
4 The European benchmark is the Dutch Title Transfer Facility futures contract, and for Asia, the Platts Japan Korea Marker contract. U.S. natural gas prices have remained steady through the conflict because the U.S. has abundant domestic natural gas production.
5 The International Energy Agency regularly updates its tracking of conservation mandates. See “2026 Energy Crisis Policy Response Tracker,” International Energy Agency, June 12, 2026.
6 Shariq Khan, “US oil exports surge, draining domestic crude inventories toward rock bottom,” Reuters, June 5, 2026.
Risks Considerations
Each asset class has its own risk and return characteristics. The level of risk associated with a particular investment or asset class generally correlates with the level of return the investment or asset class might achieve. Stock markets, especially foreign markets, are volatile. Stock values may fluctuate in response to general economic and market conditions, the prospects of individual companies, and industry sectors. Foreign investing has additional risks including those associated with currency fluctuation, political and economic instability, and different accounting standards. These risks are heightened in emerging markets. Bonds are subject to market, interest rate, price, credit/default, liquidity, inflation and other risks. Prices tend to be inversely affected by changes in interest rates. High yield (junk) bonds have lower credit ratings and are subject to greater risk of default and greater principal risk. Although Treasuries are considered free from credit risk they are subject to other types of risks. These risks include interest rate risk, which may cause the underlying value of the bond to fluctuate. The commodities markets are considered speculative, carry substantial risks, and have experienced periods of extreme volatility. Investing in a volatile and uncertain commodities market may cause a portfolio to rapidly increase or decrease in value which may result in greater share price volatility.
Definitions
An index is unmanaged and not available for direct investment.
Consumer Price Index (CPI) produces monthly data on changes in the prices paid by urban consumers for a representative basket of goods and services.
MSCI Australia Index is designed to measure the performance of the large and mid-cap segments of the Australia market.
MSCI Emerging Markets Index is a free float-adjusted market capitalization index that is designed to measure equity market performance of emerging markets.
MSCI Europe Index is a free float-adjusted market capitalization index that is designed to measure developed market equity performance in Europe. The index covers approximately 85% of the free float-adjusted market capitalization across the European Developed Markets equity universe.
MSCI Far East Index is a benchmark designed to measure the equity market performance of both developed and emerging markets in the Far East. It tracks the performance of large- and mid-cap companies across the region, heavily weighted by countries like China, Japan, South Korea, and Taiwan.
General Disclosures
Global Investment Strategy (GIS) is a division of Wells Fargo Investment Institute, Inc. (WFII). WFII is a registered investment adviser and wholly owned subsidiary of Wells Fargo Bank, N.A., a bank affiliate of Wells Fargo & Company.
The information in this report was prepared by Global Investment Strategy. Opinions represent GIS’ opinion as of the date of this report and are for general information purposes only and are not intended to predict or guarantee the future performance of any individual security, market sector or the markets generally. GIS does not undertake to advise you of any change in its opinions or the information contained in this report. Wells Fargo & Company affiliates may issue reports or have opinions that are inconsistent with, and reach different conclusions from, this report.
The information contained herein constitutes general information and is not directed to, designed for, or individually tailored to, any particular investor or potential investor. This report is not intended to be a client-specific suitability or best interest analysis or recommendation, an offer to participate in any investment, or a recommendation to buy, hold or sell securities. Do not use this report as the sole basis for investment decisions. Do not select an asset class or investment product based on performance alone. Consider all relevant information, including your existing portfolio, investment objectives, risk tolerance, liquidity needs and investment time horizon. The material contained herein has been prepared from sources and data we believe to be reliable but we make no guarantee to its accuracy or completeness.
Wells Fargo Advisors is registered with the U.S. Securities and Exchange Commission and the Financial Industry Regulatory Authority, but is not licensed or registered with any financial services regulatory authority outside of the U.S. Non-U.S. residents who maintain U.S.-based financial services account(s) with Wells Fargo Advisors may not be afforded certain protections conferred by legislation and regulations in their country of residence in respect of any investments, investment transactions or communications made with Wells Fargo Advisors.
Wells Fargo Advisors is a trade name used by Wells Fargo Clearing Services, LLC and Wells Fargo Advisors Financial Network, LLC, Members SIPC, separate registered broker-dealers and non-bank affiliates of Wells Fargo & Company.