USMCA deadline passes, adding to North American trade uncertainty
The U.S.-Mexico-Canada Agreement (USMCA), which underpins roughly $1.9 trillion in annual trade among the three countries, entered a new phase on July 1 when the U.S. declined to renew the accord. While the agreement remains in force, its required annual review process has introduced fresh uncertainty around North America's long-term trade framework. For investors, the key question is as much whether a prolonged period of uncertainty weighs on business confidence, cross-border investment, and supply-chain decisions over the coming year as it is about the agreement’s survival.
Where things stand
USMCA reached its first mandatory review on July 1, 2026. Under the agreement's sunset provision, the three governments were required to decide whether to extend the pact for another 16 years. While Mexico and Canada supported a 16-year extension, the United States declined to renew the agreement in its current form. As a result, USMCA has entered a cycle of annual reviews that will continue until all three countries agree to extend the pact or it reaches its scheduled expiration date in 2036.
The Trump administration views the review as an opportunity to reshape the agreement to better support its goals of strengthening North American supply chains. One key U.S. priority is tightening the rules of origin, which determine whether a product qualifies for tariff-free treatment under USMCA. The U.S. wants stricter standards particularly to make it harder for Chinese goods and components to enter the U.S. through Mexico or Canada while avoiding U.S. tariffs.
Why USMCA matters
North America remains one of the world’s most deeply integrated economic regions. Mexico is now the largest U.S. trading partner, accounting for roughly 15.6% of total bilateral trade in 2025, with Canada close behind at 12.8%1. According to the National Association of Manufacturers, Canada and Mexico also purchase more U.S. manufactured goods than the next 10 export markets combined. Additionally, as shown in the chart on the following page, the effective U.S. tariff rate on imports from Mexico and Canada sits just above 3% for each, well below the roughly 7% average rate.2
What’s next for North American trade
Since the annual reviews can run for a decade, none of the three governments has much incentive to rush toward a deal on unfavorable terms. Mexico and, especially, Canada, may prefer to wait rather than accept an unsatisfactory deal. A full 16-year extension remains available at any point should the parties align, and any tightening of the rules would most likely phase in gradually rather than land as a sudden shock. Outright withdrawal requires a formal six months’ notice and is a low probability outcome in our view, given how tightly the three economies are integrated and the broad support the agreement enjoys in all three economies.
What it means for investors
The unresolved USMCA contributes to a backdrop of potential summer/autumn equity-market volatility alongside geopolitical tensions, artificial intelligence (AI)-driven market dynamics, elevated inflation, and the U.S. midterm elections. We believe the more immediate impact for 2026 is uncertainty, which can weigh on business and investor confidence. A less predictable trade framework could delay cross-border investment, especially in manufacturing and supply chains, as firms dial back spending.
If annual reviews result in piecemeal side agreements, the economic impact will likely unfold gradually rather than as a sudden shock.3 Trade among the three economies will continue, and businesses likely will adapt to any changes to trade rules. Thus, we do not view USMCA-related developments as a material macroeconomic risk.
Companies have also learned to adapt to changing tariff policies over the last year and a half. Practices such as off-cycle surcharge programs, in which suppliers pass along price increases to their customers with less of a lag than traditional annual contracts, were far less common during the 2017 – 2019 period but are now more established. Trade developments have become more of a market “noise” factor than a primary driver of investment outcomes.
Still, we believe the broader pricing landscape and extraordinary investment cycle supports Industrials and Materials, sectors we are neutral and favorable on, respectively. While our view is that the USMCA matters most for the auto and agriculture industries, they represent a relatively small share of the overall equity market. More broadly, we continue to view the U.S. economy undergoing a rotation from consumer-led growth to increasingly investment-led growth. Trade policy remains part of that backdrop, but we believe AI-related capital spending and tax policy will be the more important drivers of economic and market performance.
Chart 1. USMCA partners enjoy lower U.S. effective tariff rates compared to peers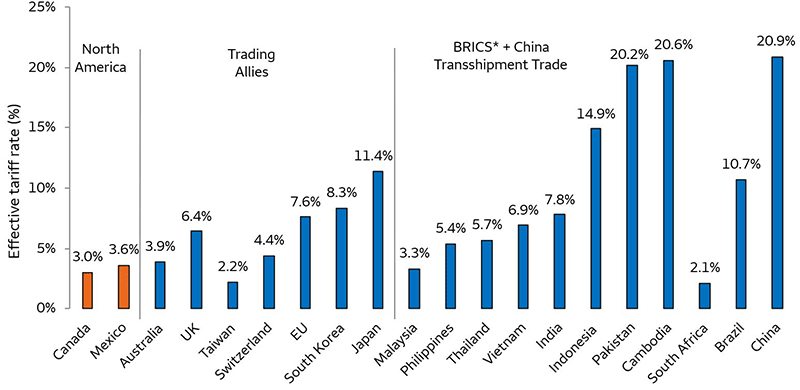
Sources: Wells Fargo Investment Institute, U.S. Census Bureau, and Strategas. Latest data through May 2026. *BRICS is an organization of major emerging economies like Brazil, Russia, India, China, and South Africa. It has expanded to include Egypt, Ethiopia, Iran, the United Arab Emirates, and Indonesia.
At nearly $600 billion in sales, Canada and Mexico purchase more U.S. manufactured goods than the next 10 trading partners combined.
Source: “USMCA: A Strong North America Powers a Strong Manufacturing Economy.” National Association of Manufacturers (NAM). December 5, 2025.
1 “USMCA Has Strengthened Economic Integration in North America.” 2026. Brookings. March 4, 2026.
2 “Effective Tariff Rates and Revenues (Updated June 16, 2026).” Penn Wharton Budget Model. June 16, 2026.
3 “USMCA 2.0: Rolling Reviews, Rising Friction.” Wells Fargo Economics. June 25, 2026.
A market wild card moves to center stage
With the nation’s 250th birthday celebration behind us, investor attention is likely to shift toward the November midterm elections. Midterms matter because they can change control of Congress, which may have a direct role in taxes, spending, health-care policy, energy, trade, and regulation. These policy areas can affect corporate profits, interest rates, inflation expectations, and investor confidence.
The runup to elections often brings more uncertainty than clarity. Markets typically care less about party labels and more about the policies that may follow. We think investors should focus on three questions: whether potential election outcomes make large policy changes more or less likely, whether they raise the odds of budget disputes or a government shutdown, and whether they change the outlook for sectors tied closely to regulation, public spending, or household affordability.
Why congressional control matters
All 435 House seats, 35 Senate seats, and 36 governorships are on the ballot this year. For investors, the most important outcome is whether one party controls both chambers of Congress or whether power is divided. A related question is whether a majority party can hold 60 Senate seats to defeat filibusters that otherwise could block the majority’s proposals. Unified control can make it easier to pass major tax, spending, and regulatory legislation. In recent years, it has become increasingly important to watch whether a party can gain a House majority, too. The reason, in our view, is that the reconciliation bill process for streamlining budget bills can require only simple majorities to pass and thereby avoid the filibuster.
The issues investors should watch
The main campaign issues are likely to be economic ones: affordability, health care costs, inflation, energy prices, housing, immigration, trade, and the federal budget. These issues matter to households, but they also matter to markets. Higher living costs can affect consumer spending. Health care and drug-pricing debates can influence the Health Care sector. Energy prices can affect inflation and household budgets. Trade and immigration policy can affect labor supply, supply chains, and business costs.
Affordability may be the easiest way to connect these issues. Many voters are focused on the cost of essentials, including health care, groceries, housing, utilities, and gasoline. For investors, we think the takeaway is that policies aimed at lowering household costs could create winners and losers across sectors. Some proposals could support consumer spending while others could pressure margins in industries facing new price controls, taxes, regulation, or spending cuts.
Chart 2. Gallup poll on American worries on key economic issues in 2026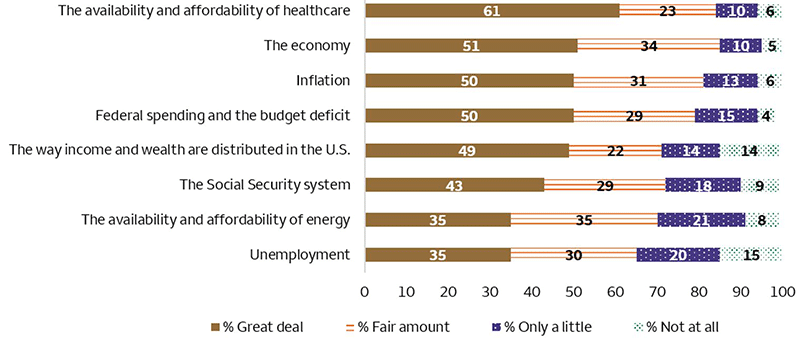
Sources: Gallup, “Healthcare Reclaims Top Spot Among U.S. Domestic Worries,” March 31, 2026; Wells Fargo Investment Institute. Gallup survey percentages do not total 100% because respondents independently rate their level of worry for 16 separate policy areas, allowing individuals to express "a great deal" of concern for several issues simultaneously.
What it could mean for investors
To reiterate, we expect market volatility this summer and possibly into the autumn around various questions, including the midterm elections, but also AI spending, economic growth, inflation, and Federal Reserve (Fed) interest-rate policy. Still, we expect strong corporate earnings growth and opportunities, starting with our preference for equities over fixed income. Thus, during this midterm campaign season, we favor using periods of market weakness around these uncertainties as potential opportunities to leg into U.S. Large Cap Equities and especially our favored sectors: Financials, Materials, Information Technology, and Utilities.
From 1934 to 2018 the party in the White House lost an average of 28 House seats and 4 Senate seats in the midterms.
Source: Britannica. “United States Midterm Elections.” June 2, 2026.
The Cook Political Report rates four Republican-held Senate seats — Alaska, Maine, Ohio and North Carolina — as toss ups or leaning Democratic in the November 2026 elections, compared to just Michigan as a Democratic seat rated as an election toss-up.
Source: “2026 CPR Senate Race Ratings,” July 1, 2026”
Inflation outlook and key drivers
Inflation looks like it may be close to a turning point, but we believe the next stage could be slow and uneven. The Consumer Price Index (CPI) rose 3.5% for the 12 months ending June 2026, with energy playing a major role. CPI is one of the federal government’s main measure of consumer inflation. It tracks the average change in prices for a basket of goods and services, including groceries, gasoline, rent, medical care, and transportation.
Why the Strait of Hormuz matters
Energy is not the largest part of CPI, but elevated fuel prices can boost transportation costs and so add to inflation across a range of goods. The Strait of Hormuz is among the world’s most important energy shipping routes, a narrow passage for roughly 20% of global oil, liquefied natural gas, and their derivative products. The June 17, 2026 U.S.-Iran Memorandum of Understanding outlined opening the Strait during a 60-day period to negotiate a lasting peace agreement. That is encouraging, but the peace remains fragile. Iran has continued to sporadically target commercial vessels that do not cross the Strait as Iran prescribes, and the U.S. has retaliated with military strikes and restrictions on new Iranian oil sales. While tankers face possible attack, pre-war oil flows are unlikely to fully return in our view. This is one reason we see that gasoline and other refined product prices have not declined as quickly as oil prices.
Base case
Our base case is that inflation peaks in 2026 and gradually eases alongside less Middle East tensions and slower economic growth into 2027. Under our forecast, 12-month CPI inflation falls from about 3.4% in December 2026 to 2.8% in December 2027. This outlook depends on two key assumptions: oil prices stabilize or decline, and the economy cools modestly in the second half of 2026. The most likely risk we see is that if consumer spending remains firm and AI-related investment continues to support growth, inflation may not fall as quickly as we expect.
The uncertain path of U.S.-Iran negotiations likely maintains a premium on oil prices, even under our outlook for gradually increasing commercial traffic through the Strait. Although we expect inflation to ease into 2027, current interest-rate market pricing perceives enough inflation uncertainty that interest-rate futures markets continue to price one or two quarter-point increases in the Fed’s interest rate target (and a similar increase in the prime interest rate) over the coming 12 – 18 months.
However, our view is that slower consumer-spending growth will allow policy-makers to hold rates steady. Meanwhile, we expect corporate technology spending growth to support strong earnings growth, even as consumer spending slows. Our equity outlook remains driven primarily by our earnings outlook, and we regard price pullbacks as potential buying opportunities, especially in our favored sectors previously mentioned. In fixed-income markets, the inflation uncertainty is more material than for equity markets and pushes our preference to short-term maturities (less than three years) in investment-grade corporate securities.
What it means for investors
For investors, the key question is not just whether inflation falls, but how quickly. Our expectation is that the Fed remains on hold, which would likely be a constructive backdrop for markets because investors would have more confidence that interest rates are not moving higher. However, if inflation proves stickier than expected, the Fed could be forced to increase interest rates again. While not our base case, that outcome could pressure stocks and bonds by raising borrowing costs and weighing on interest-rate-sensitive parts of the market.
In the current environment, we believe investment quality matters. We continue to favor U.S. Large Cap Equities over U.S. Small Cap Equities. Larger companies generally have stronger balance sheets, steadier earnings, and more ability to manage higher borrowing costs. Many also have more pricing power, which can help protect profit margins if inflation remains elevated.
We also continue to prefer U.S. equities relative to international developed markets, supported by the relative strength of the U.S. economy. Inflation appears to be moving lower, but the final move back toward the Fed’s 2% target may be more difficult than the initial decline. Lower oil prices help, but stronger growth and resilient consumers could keep inflation above target for longer than expected.
The index for shelter, which includes rent of primary residence and owners’ equivalent rent of residence accounts for roughly 35% of CPI.
Source: Bureau of Labor Statistics. February 13, 2026.
The Strait of Hormuz handles approximately $600 billion worth of trade annually, including 20% of the world's oil, 20% of liquefied natural gas (LNG), and 30% of the fertilizer used globally.
Source: BBC. April 2026.