Will higher rates spook this economy?
Rising U.S. Treasury yields have ushered in a fall chill for financial markets. For many investors, higher interest rates evoke memories of recessions and market downturns. Yet the current environment appears to us more nuanced than the traditional late-cycle pattern — when higher interest rates typically slow credit demand, business investment, and consumer spending.
First, it is important to understand why yields are rising. Persistent inflation pressures and expectations for additional Federal Reserve (Fed) policy tightening have played a role. But monetary policy is only part of the story. Elevated budget deficits, heavy Treasury issuance, and increased competition for capital, particularly from corporations funding the artificial intelligence (AI) buildout, are also pushing long-term interest rates higher. Moreover, we believe some of the recent increase in real (inflation-adjusted) yields reflects improving growth and productivity expectations tied to AI adoption rather than a deterioration in financial conditions. In our view, rates are not yet restrictive enough to derail economic growth, in part because AI-related investment has so far remained relatively insensitive to higher borrowing costs.
What lies beneath a peculiar economic cycle: Uneven interest-rate sensitivity
The current AI-led investment cycle remains the primary secular force powering economic growth. Businesses continue to invest heavily in data centers, power generation, communications infrastructure, and productivity-enhancing technologies. Most of these projects are motivated by long-term strategic opportunities rather than short-term financing costs. Moreover, much of the AI buildout has thus far been financed internally, reducing its sensitivity to higher interest rates. As a result, overall business spending has remained remarkably resilient. We estimate real capital-goods orders grew at a double-digit pace in the three months through August, the strongest clip since the post-pandemic recovery in late 2020.
However, parts of the economy have become more vulnerable to rising rates after years of unusually low borrowing costs boosted asset prices and encouraged debt accumulation. Housing affordability has been suppressed by elevated home prices and higher mortgage rates, while growing federal debt has increased the government’s sensitivity to refinancing costs. Consumer spending has also benefited from strong gains in stock and home prices, creating wealth effects that could fade if higher rates eventually pressure asset valuations.
The real test: Liquidity conditions
Historically, rising rates slow growth by restricting the cash available for investment and spending, or liquidity. While pockets of strain are emerging, we do not see evidence that credit availability has deteriorated enough to materially impede economic activity.
Measures of overall financial conditions continue to signal adequate, if not ample, liquidity. Real 10-year Treasury yields have moved higher but remain near historical norms rather than levels typically associated with acute financial stress, such as occurred in 2008 (see Chart 1). The yield spread between non-investment grade bonds and comparable U.S. Treasury securities has widened recently as investors recalibrate risk, but they remain well below long-term averages.
Chart 1. “Normal” real rates have yet to summon increased financial stress 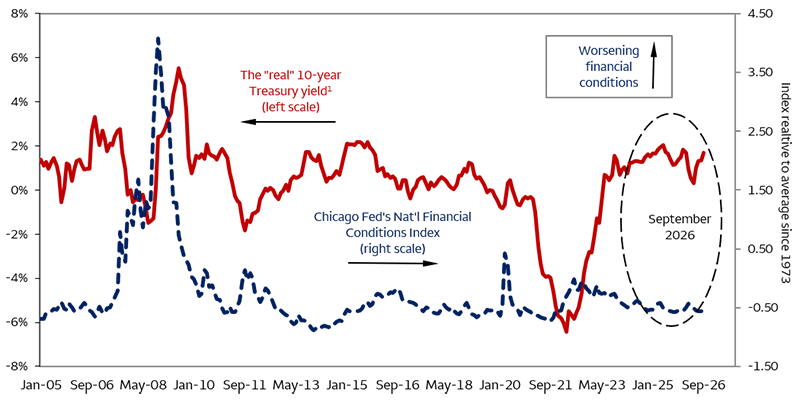
Sources: Wells Fargo Investment Institute, Bloomberg, Federal Reserve Board, and the U.S. Labor Department. Data as of September 30, 2026. 1The 10-year Treasury yield less 12-month Consumer Price Index (CPI) inflation. September 2026 CPI estimated at 3.6%.
The greater risk may be that home and financial asset valuations, which have helped drive strong gains in household wealth and spending, were established in a much lower-rate environment. As a result, they could face pressure from further rate increases, even with rates only modestly above their historical norm.
The economy’s balancing act
Even if economic growth moderates in coming quarters, as we anticipate, the economy appears well cushioned by forces that are atypical for this stage of a business cycle. AI-related investment continues to drive business spending, while healthy financial conditions and past wealth creation have helped sustain consumer demand. We believe these strengths, coupled with AI-related productivity gains, will help offset growing weakness in the economy’s more credit-sensitive sectors. While some productivity gains reflect businesses investing in more equipment and technology, increasing use of AI across operations and decision-making processes appears to be improving how labor and capital are combined, supporting greater efficiency and helping sustain economic growth.
Higher yields less “trick” and more “treat” for investors
Higher interest rates are creating winners and losers across the economy, but in our view, they do not signal a recession upending investment returns. While some rate-sensitive sectors may face additional pressure, we believe the broader economy and stock market remain well supported by AI-driven investment, strong earnings growth, resilient consumer spending, and sufficiently accommodative financial conditions.
For investors, we think higher yields represent more opportunity than threat. Bonds are once again providing attractive income and serving as portfolio ballast, even if higher yields weigh on prices in the near term. Thus, we favor maintaining diversified fixed-income exposure while being mindful of interest-rate risk, particularly at longer maturities, and we continue to prefer shorter maturities over longer maturities.
Narrow market leadership ahead of midterms
Since 1961, the S&P 500 Index has typically weakened ahead of midterm elections before rebounding in October and rallying into year-end (see Chart 2). This year, though, the market has remained resilient. The index was nearly flat in September, declining roughly 0.45%, but has generally trended higher since mid-June, reaching record highs in August and again in October. That strength persisted despite elevated Treasury yields, a spike in oil prices, and a Fed interest-rate hike.
Chart 2. Equities have often rallied after the midterms 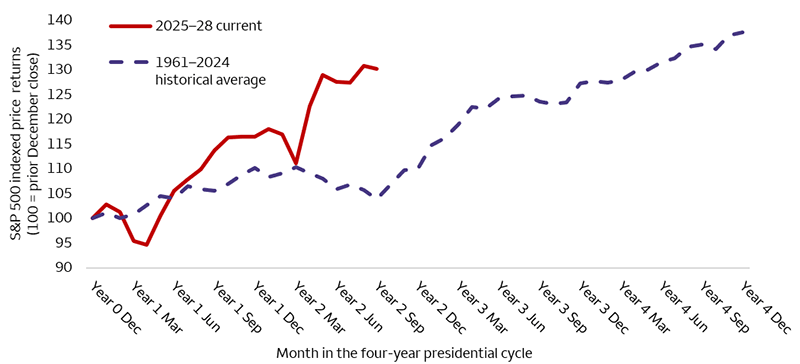
Sources: Wells Fargo Investment Institute and Bloomberg. Daily data from December 31, 1960, through September 30, 2026. The horizontal axis represents the four-year U.S. presidential election cycle, beginning after a presidential election (Year 0). Midterm elections occur during Year 2 of the cycle. An index is unmanaged and not available for direct investment.
Past performance is no guarantee of future returns.
The resilience has been backed by real strength: corporate earnings are solid, AI continues to fuel growth, and Bloomberg estimates third- and fourth-quarter earnings to rise roughly 25% year-over-year, as of October 6, 2026. The economy is accelerating too, with the Atlanta Fed estimating third-quarter gross domestic product (GDP) growth at 3.7% annualized as of September 30, up from 2.2% in the second quarter.
Still, the headline numbers mask some weakness. While the S&P 500 Index traded near all-time highs through September, the breadth has been narrow. Information Technology and Communication Services were the only sectors to post positive returns in September, while the equal-weighted S&P 500 Index, which gives each company the same weight, fell nearly 5%. This narrow participation suggests that a relatively small group of companies is carrying much of the market’s recent uptrend.
What it means for investors
Headline strength should not drive investment decisions on its own. Elections, rising energy prices, higher yields, and a cautious Fed could still spark a broader market pullback in the weeks ahead. We would view broad-market weakness as an opportunity to add selectively. We continue to favor U.S. Large Cap Equities and attractively valued sectors tied to AI investment, including Communication Services, Industrials, and Materials.
Responding to the decline in long-term bond prices
Investors in long-term bonds have faced a challenging period. Although bonds are often viewed as stable investments, rising rates have lowered prices and returns on bonds the investor holds and prompted investors to reassess their long-term holdings. When newly issued bonds offer higher rates, existing bonds become less attractive, and their prices generally fall. Longer-term bonds have the less favorable rate locked in for longer, and so are more sensitive to yield changes. This sensitivity to changes in market yields is referred to as duration. Long-term bonds are more sensitive to these changes, a characteristic known as duration. Long-term bond prices have been significantly impacted by rising yields over the past 10 years (see Chart 3). How should investors be responding to these unexpected declines?
Chart 3. Long-term bond prices have fallen in the last 10 years 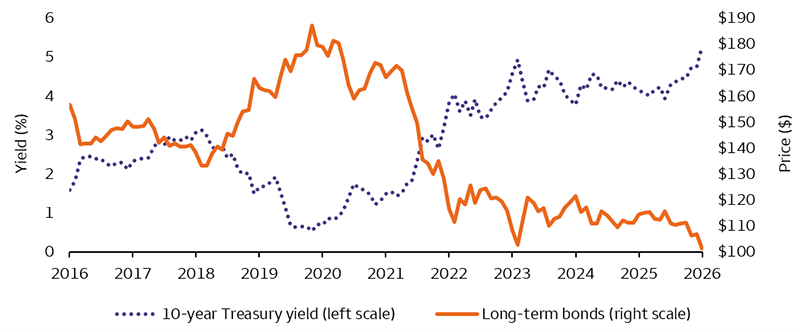
Sources: Bloomberg and Morningstar, data as of September 30, 2026. Long-term bonds are represented by the price of the Morningstar U.S. 10+ Year Core Bond Index and does not include coupon returns. The starting price level of this index was 156.55 on September 30, 2016, and the last value was 101.31 on September 30, 2026. An index is unmanaged and not available for direct investment.
Past performance is no guarantee of future returns.
We expect long-term yields to remain under upward pressure as investors continue to focus on inflation and the growing supply of U.S. government debt. While we are unfavorable on Long Term U.S. Taxable Fixed Income as a result, we do not believe investors should abandon bonds entirely. Instead, we favor managing interest-rate risk to ensure that bond holdings match investment goals and believe the rising yields may offer repositioning opportunities for investors.
Tax-loss harvesting decisions depend on an investor’s individual circumstances, and if applicable, investors may be able to sell long-term bonds that are trading below their purchase price, use the realized losses to offset taxable investment gains, and reinvest the proceeds in shorter investment-grade maturities, whose yields have risen since summer and which generally have lower duration and therefore less sensitivity to rising interest rates. In today’s higher-yield environment, this approach may allow investors to continue generating income while reducing interest-rate risk. Investors who do not need these funds in the near term may instead choose to hold high-quality individual bonds until maturity, when the issuer is expected to repay the principal, provided it can meet its obligations.
What is the futures curve telling us about oil?
Today’s oil price reflects current risks, while the futures curve, the price of oil for delivery in future months, provides insight into what markets expect ahead. For investors, the key question is not just what oil costs right now, but what risks the market sees over the coming year.
For background, Brent’s futures curve shows the price of crude oil at different delivery dates, and the shape of the curve says a lot. Today, Brent's curve is in backwardation, meaning oil costs more for delivery sooner rather than later. That shape usually shows up when supply is tight. Generally, the steeper the slope, the more risks the market is worried about in the near term (see Chart 4).
Chart 4. Comparing Brent’s futures curve throughout the conflict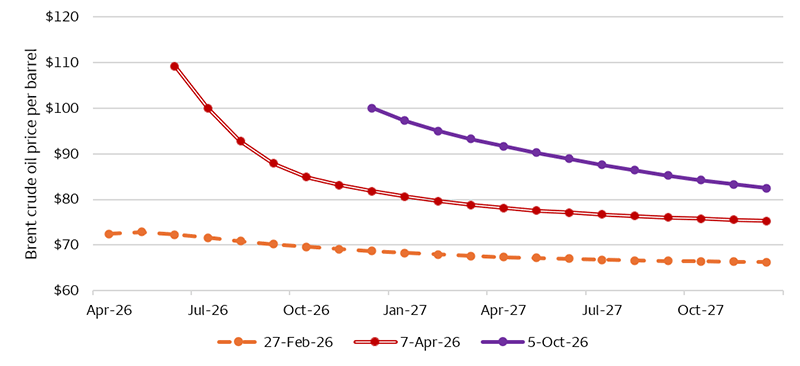
Sources: Bloomberg and Wells Fargo Investment Institute. Daily data is as of October 5, 2026. Each curve represents the series of future prices of oil for delivery as of the date indicated.
Comparing the curve at three different times — before the war, before the first ceasefire, and today — reveals how expectations have shifted. Before the war, markets expected an adequate supply, with little concern for shortages, and so the curve was nearly flat (orange line). That flipped once the Middle East conflict cut off roughly 20% of the world’s oil supply, which pushed the curve into steep backwardation (red line). Yet, much of the steepness sat in 2026, meaning the market assumed supply disruptions would be temporary and normalize by 2027.
Today, market appears less concerned about severe shortages over the coming months than it did during the summer, shown by a tighter spread between the current price and next closest month (purple line, first two dots). However, the 2027 portion of the curve has steepened, which suggests markets now believe tight supply could last longer than previously expected. Furthermore, the entire curve has also shifted higher as the conflict has dragged on.
For investors, this echoes our view that energy markets could remain tight for a while. We still recommend commodities as a hedge against energy-driven inflation risks, and we recently raised our 2027 year-end forecasts for West Texas Intermediate and Brent crude to $75–$85 and $80–$90 per barrel, respectively.
Tax efficiency through long/short investing
Traditional tax-loss harvesting strategies, such as direct indexing, hold individual securities and seek to realize capital losses when stock prices decline. These losses can be used to offset gains elsewhere, potentially reducing an investor's tax liability in a given year.1 While often effective in the early years, the loss-generating potential of these strategies may diminish over time as market values generally appreciate and fewer positions remain below their cost basis.
Tax-aware long/short strategies seek to expand the opportunity set for tax-loss harvesting. By utilizing leverage and short selling,2 these strategies increase the number of positions that can potentially generate realized losses (see Chart 5). Because they maintain both long and short exposures, managers may be able to harvest losses through market cycles, realizing losses on short positions during rising markets and on long positions during major drawdowns. This broader opportunity set may also provide greater flexibility for managers to pursue pre-tax excess returns while maintaining portfolio risks consistent with benchmark objectives.
When thoughtfully designed and implemented, tax-aware long/short strategies may also help long-term investors transition highly appreciated concentrated positions in a more tax-efficient manner.
Despite their potential tax advantages, we believe investors should carefully weigh these benefits against the risks associated with long/short tax-aware strategies, including leverage, short selling, higher fees, potentially less liquid fund structures, as well as evolving tax regulations.3
Chart 5. Long/short tax-aware strategies aim to expand the opportunity available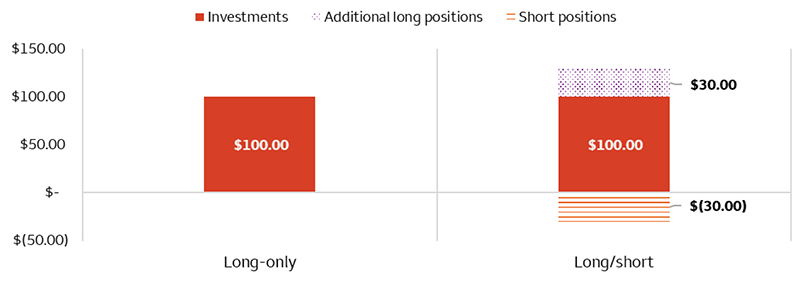
Sources: Wells Fargo Investment Institute, as of October 5, 2026. For illustrative purposes only. The chart assumes a hypothetical $100 investment in a traditional long-only strategy (left). The 130/30 strategy shown on the right consists of $130 in long positions and $30 in short positions. Actual tax-aware long/short strategies may employ different levels of long and short exposure and may not reflect the allocations shown in this example.
Alternative investments, such as hedge funds, private equity, private debt and private real estate funds are not appropriate for all investors and are only open to “accredited” or “qualified” investors within the meaning of U.S. securities laws.
1 Tax-loss harvesting strategies generally defer tax liabilities by selectively realizing losses, while accumulating unrealized gains over time. As a result, the terminal tax benefits depend on the investor’s exit strategy, whether through asset sales, charitable donations, or estate transfers.
2 Leverage involves using borrowed capital to increase investment exposure, while short selling involves borrowing and selling a security with the expectation of repurchasing it later at a different price.
3 Potential tax benefits are dependent on prevailing tax laws and Internal Revenue Service interpretations, both of which are subject to change. Wells Fargo Investment Institute does not provide tax or legal advice; investors should consult with their tax and legal advisors before implementing any investment strategy.
Cash Alternatives and Fixed Income
intentionally blank
intentionally blank
intentionally blank
| Most Unfavorable |
Unfavorable |
Neutral |
Favorable |
Most Favorable |
|
intentionally blank
|
- Developed Market Ex-U.S. Fixed Income
- U.S. Long Term Taxable Fixed Income
|
- Cash Alternatives
- Emerging Market Fixed Income
- High Yield Taxable Fixed Income
- U.S. Intermediate Term Taxable Fixed Income
|
- U.S. Short Term Taxable Fixed Income
|
intentionally blank
|
Equities
| Most Unfavorable |
Unfavorable |
Neutral |
Favorable |
Most Favorable |
|
intentionally blank
|
|
- Developed Market Ex-U.S. Equities
- Emerging Market Equities
- U.S. Mid Cap Equities
|
|
intentionally blank
|
Real Assets
| Most Unfavorable |
Unfavorable |
Neutral |
Favorable |
Most Favorable |
|
intentionally blank
|
intentionally blank
|
- Digital Assets
- Private Real Estate
|
- Commodities
- Private Infrastructure
|
intentionally blank
|
Alternative Investments**
| Most Unfavorable |
Unfavorable |
Neutral |
Favorable |
Most Favorable |
|
intentionally blank
|
intentionally blank
|
- Hedge Funds—Equity Hedge
- Hedge Funds—Macro
- Hedge Funds—Relative Value
- Private Equity
- Private Debt
|
|
intentionally blank
|
Source: Wells Fargo Investment Institute, October 12, 2026. Please see Wells Fargo Investment Institute's Asset Allocation Strategy Report for more detailed, investable ideas in each asset group.
*Tactical horizon is 6-18 months
**Alternative investments are not appropriate for all investors. They are speculative and involve a high degree of risk that is appropriate only for those investors who have the financial sophistication and expertise to evaluate the merits and risks of an investment in a fund and for which the fund does not represent a complete investment program. Please see end of report for important definitions and disclosures.