


In today’s rapidly evolving economic and market environment, having clear, data-driven insights is essential. This collection brings together a focused set of charts and tables drawn from Wells Fargo Investment Institute’s broader Market Charts presentation deck, highlighting the key trends shaping the path forward for the economy and financial markets.
Key takeaways
- In our view, earnings growth will drive further gains in U.S. stocks in 2026 and 2027. We expect long-term interest rates to move higher due to solid economic growth, sticky inflation, and increased U.S. Treasury issuance to fund growing deficit needs.
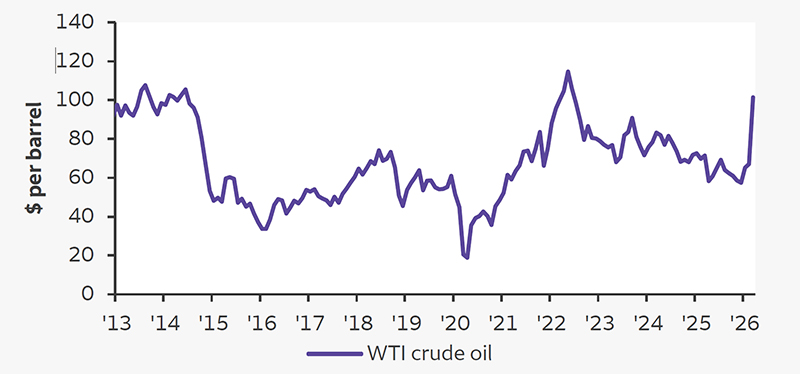
- We believe oil prices will gradually decline late in 2026 and by year-end 2027 as war-related “risk premiums” fade and major oil producers, including OPEC+1, ramp up production. We view supply-demand fundamentals as stronger for industrial metals.
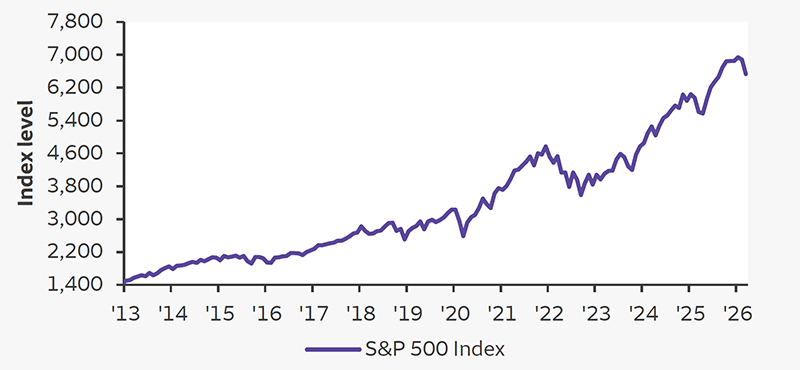
The war has narrowed breadth of stock market gains
Oil prices have risen with geopolitical turmoil
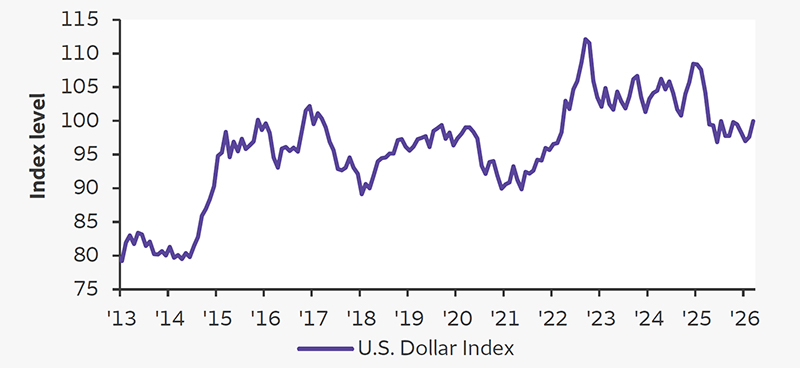
U.S. dollar has emerged as a perceived safe haven asset
Inflation beyond Fed’s target
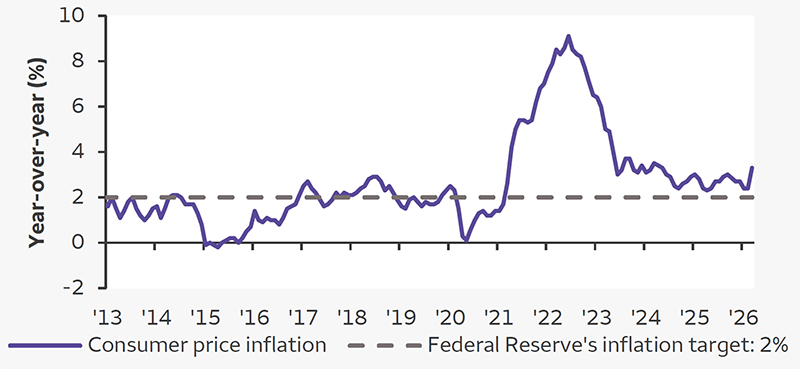 Sources: Bloomberg and Wells Fargo Investment Institute. Monthly data from January 1, 2013, to June 30, 2026. The S&P 500 Index is a market capitalization-weighted index composed of 500 widely held common stocks that is generally considered representative of the U.S. stock market. The Consumer Price Index measures the average price of a basket of goods and services. West Texas Intermediate (WTI) is a grade of crude oil used as a benchmark in oil pricing. U.S. Dollar Index (USDX) measures the value of the U.S. dollar relative to the majority of its most significant trading partners. This index is similar to other trade-weighted indexes, which also use the exchange rates from the same major currencies. An index is unmanaged and not available for direct investment. Past performance is no guarantee of future results. Stocks may fluctuate in response to general economic and market conditions, the prospects of individual companies, and industry sectors. Fed = Federal Reserve.
1 Organization of the Petroleum Exporting Countries plus allies.
Key takeaways
- We believe supply-chain disruptions tied to the Iran war will dampen but not derail U.S. economic growth in 2026. We view the U.S. as better insulated than during past oil shocks given its position as a net oil exporter, increased reliance on services, recent policy stimulus, and the rapid absorption of artificial intelligence (AI) and other tech innovations driving productivity gains.
- We expect the energy-driven rise in inflation to be limited by underlying disinflationary pressures, including slowing rental and services inflation, more gradual tariff increases, and the effect of deregulation and productivity gains on labor and other costs.
Global economic forces
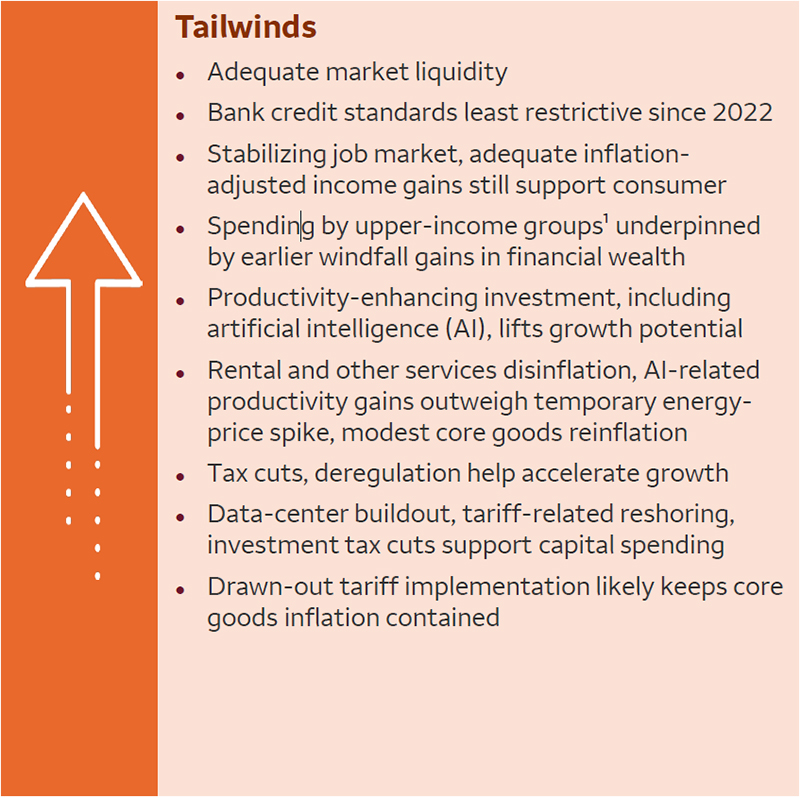
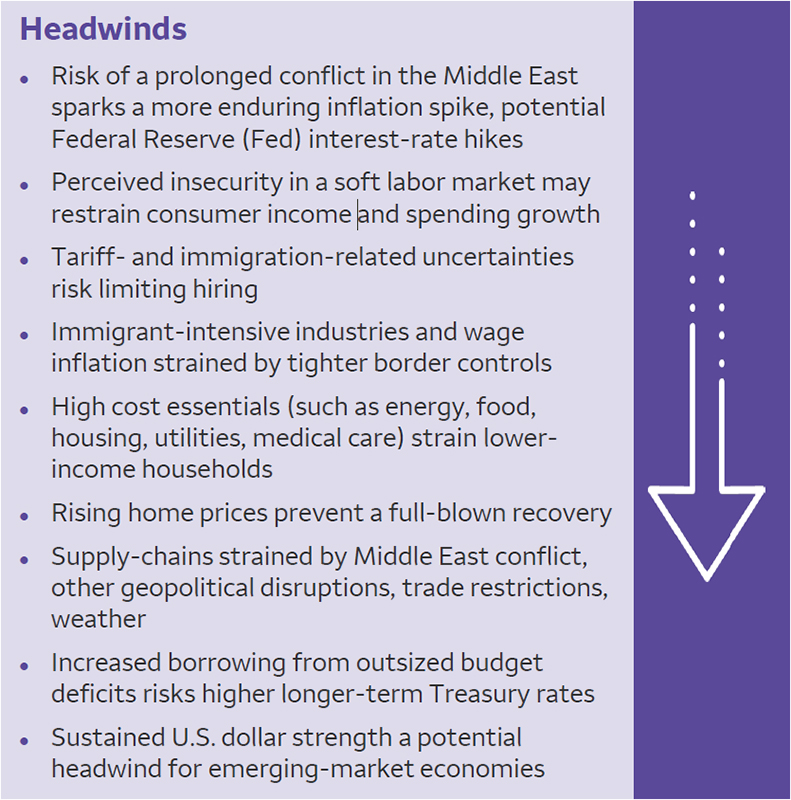 Source: Wells Fargo Investment Institute, as of June 30, 2026. Subject to change.
1 Federal Reserve Board, Financial Accounts of the U.S., as of June 11, 2026.
Key takeaways
- Our view is that the U.S. economy will lose some momentum in the second half of 2026 as higher inflation dampens consumer spending. We think ongoing strength in AI-related spending will be a key cushioning element. Renewed disinflation in 2027, along with lingering support from last year’s tax legislation, should contribute to stronger growth in 2027.
- We expect the inflation spike to ease late in 2026 as price pressures in energy, food, and tradeable goods begin to unwind, while core services inflation likely cools from a slowing economy. Disinflation in 2027 should lift consumer purchasing power.
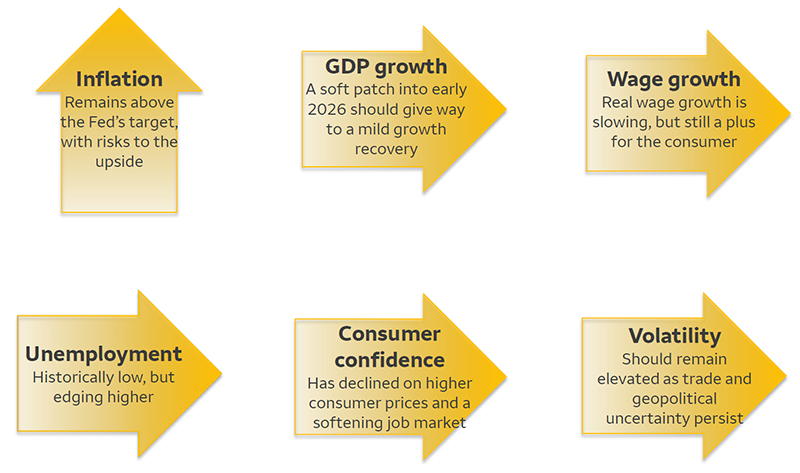 Source: Wells Fargo Investment Institute, as of June 30, 2026. Subject to change. GDP = gross domestic product. Fed = Federal Reserve.
Key takeaways
- We expect a rotation from consumer- to investment-led growth to help cushion the U.S. economy in 2026. Renewed disinflation should help revive consumer spending in 2027, contributing to a reacceleration of economic growth.
- We expect the U.S. stock market to finish 2027 higher, driven primarily by earnings growth especially related to AI capital investment.
U.S. economic growth should recover in early 2026
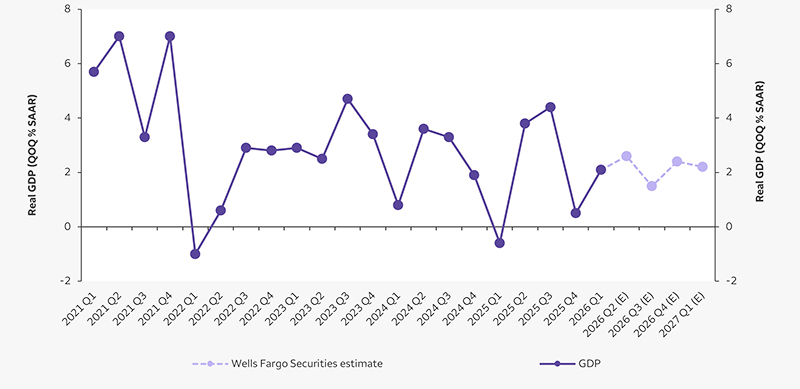 Sources: Bloomberg, Wells Fargo Securities, and Wells Fargo Investment Institute. Quarterly data from January 1, 2021, to March 31, 2026. Q2 2026 – Q1 2027 are Wells Fargo Securities forecasts, as of June 25, 2026. Forecasts are not guaranteed and are subject to change. GDP = gross domestic product. QOQ = quarter over quarter. SAAR = seasonally adjusted annual rate. Q1 = first quarter. Q2 = second quarter. Q3 = third quarter. Q4 = fourth quarter. E = estimates. Forecasts are based on certain assumptions and on views of market and economic conditions which are subject to change.
Key takeaways
- The business cycle can help inform the investing decision process.
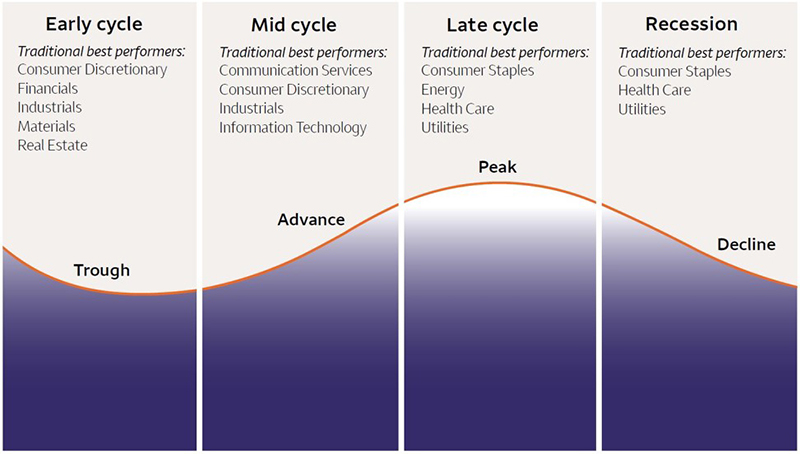 Source: Wells Fargo Investment Institute, as of June 30, 2026. Past performance is no guarantee of future results. Traditional best performers are based on the performance of S&P 500 Index sectors during a particular point in the economic cycle (early, mid, late, recession) since September 1989, the inception date for the S&P 500 sector indexes. Stock markets, especially foreign markets, are volatile. Stock values may fluctuate in response to general economic and market conditions, the prospects of individual companies, and industry sectors. Sector investing can be more volatile than investments that are broadly diversified over numerous sectors of the economy and will increase a portfolio’s vulnerability to any single economic, political, or regulatory development affecting the sector. This can result in greater price volatility. Foreign investing has additional risks including those associated with currency fluctuation, political and economic instability, and different accounting standards. These risks are heightened in emerging and frontier markets.
Key takeaways
- AI and other tech investment has accounted for a disproportionate share of economic growth in recent years. By our estimate, tech investment, less than 10% of inflation-adjusted gross domestic product in the latest four quarters, accounted for nearly 40% of the growth during the period.
- Beyond investment, tech contributes to economic growth by propelling double-digit growth of corporate profits, needed to finance capital and labor expenses, and by fueling wealth-producing gains in the stock market supporting consumer spending.
AI and other tech investment are driving economic growth
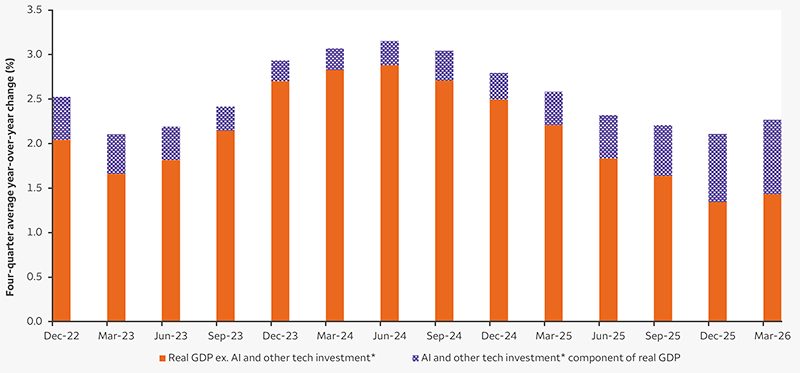 Sources: U.S. Census Bureau, U.S. Department of Commerce, and Wells Fargo Investment Institute. Quarterly data from December 31, 2022, to March 31, 2026. *Data centers, power, tech and other electronic structures, info-processing equipment & software. GDP = gross domestic product. AI = artificial intelligence. Risks associated with the Technology sector include increased competition from domestic and international companies, unexpected changes in demand, regulatory actions, technical problems with key products, and the departure of key members of management. Technology and Internet-related stocks, especially smaller, less-seasoned companies, tend to be more volatile than the overall market.
Key takeaways
- Investors looking to gain exposure to the AI theme can consider U.S. Large Cap Equities, as well as the Information Technology, Communication Services, Industrials, and Utilities sectors.
Generative AI spending is expected to surge over the next six years
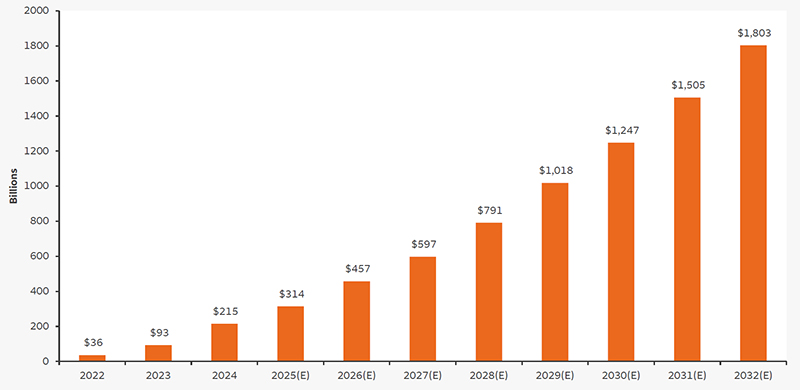 Sources: Bloomberg, eMarketer, International Data Corporation (IDC), Statista, and Wells Fargo Investment Institute, as of June 30, 2026. The bars represent the current and forecasted annual revenue as a result of AI. E = estimate. 2025 to 2032 data are estimates. Estimates are not guaranteed and based on certain assumptions and on views of market and economic conditions which are subject to change. Equity securities are subject to market risk which means their value may fluctuate in response to general economic and market conditions and the perception of individual (issuers. An investment that is concentrated in a specific sector may be subject to a higher degree of market risk.
Key takeaways
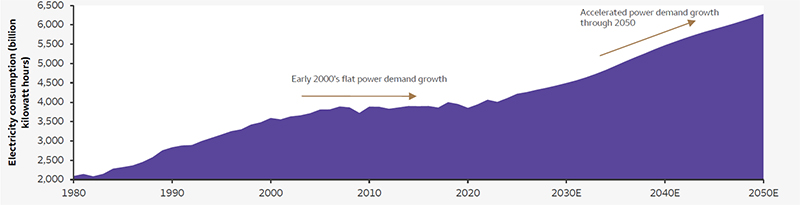
- The adoption of emerging technologies such as AI, and the required data centers and electrification for them, are driving higher demand for power generation.
- Following over a decade of minimal power demand growth, we believe demand for power generation will be a strong tailwind for Energy sector performance as the buildout of these energy-intensive technologies continues to grow.
Power demand inflecting higher
AI data centers require massive amounts of power
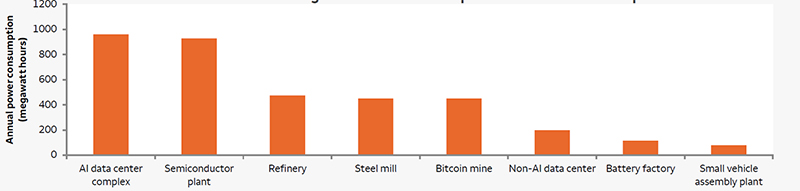 Sources: Top chart: U.S. Energy Information Administration (EIA) and Wells Fargo Investment Institute. Annual data from January 1, 1980, to December 31, 2024. EIA forecast data from 2025 – 2050 as of June 30, 2026. Total renewables includes hydro, geothermal, wind, solar, and biomass primary energy consumption. E = estimate. Forecasts are not guaranteed and based on certain assumptions and on views of market and economic conditions which are subject to change. Bottom chart: Company reports, Syracuse website, wvmetronews website, KERANews, AFL Hyperscale, Assembly Magazine, Energy Star, and Wells Fargo Investment Institute. Data as of June 30, 2026.
Key takeaways
- While the S&P 500 Index appears expensive, index valuations are heavily influenced by a few mega-cap names.
- Looking at the index on an equally weighted basis shows that stock valuations are generally in line with historical averages.
S&P 500 Index versus S&P 500 Equal Weighted Index P/Es
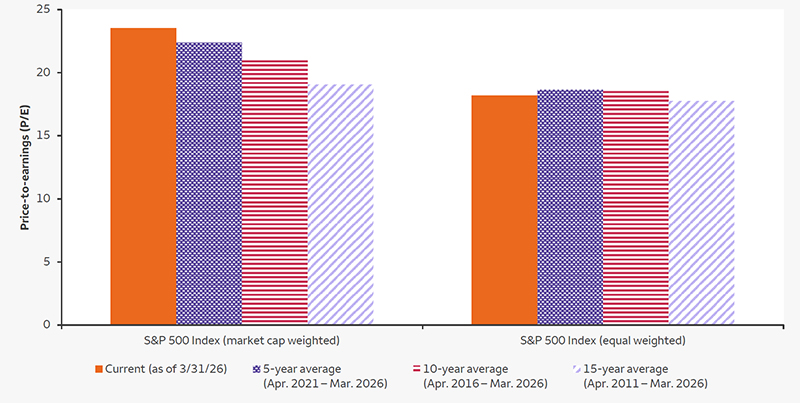 Sources: Bloomberg and Wells Fargo Investment Institute. Daily data from July 1, 2011, to June 30, 2026. P/E = price-to-earnings. The S&P 500 Index is a market-capitalization-weighted index considered representative of the U.S. stock market The S&P 500 equal weighted index is the equal-weighted version of the S&P 500 that includes the same constituents of the S&P 500 allocated to an equal weight. Index returns do not represent investment performance or the results of actual trading. Index returns represent general market results and do not reflect deduction for fees, expenses or taxes applicable to an actual investment. An index is unmanaged and not available for direct investment. Past performance is no guarantee of future results. Investing in stocks involves risk and their returns and risk levels can vary depending on prevailing market and economic conditions. All investing involves risk including the possible loss of principal.
Key takeaways
- While market sentiment has stretched tech valuations, they are nowhere near the levels reached in 2000, at the height of the tech bubble.
S&P 500 Index P/Es now versus during the tech bubble
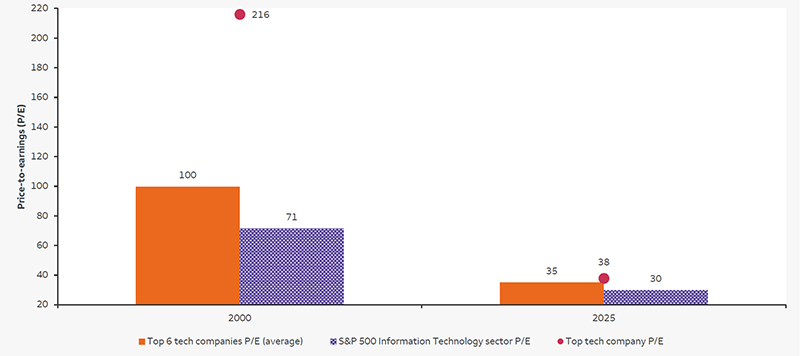 Sources: Bloomberg and Wells Fargo Investment Institute. Monthly data from March 27,2000, to June 30, 2026. P/E = price to earnings. Trailing 12-month P/E ratio is displayed. Top 6 measured as the top six tech companies by market cap as of March 27, 2000, to March 31, 2026. The S&P 500 Index is a market-capitalization-weighted index considered representative of the U.S. stock market. An index is unmanaged and not available for direct investment. Past performance is no guarantee of future results. Investing in stocks involves risk and their returns and risk levels can vary depending on prevailing market and economic conditions. Technology and internet-related stocks, especially of smaller, less-seasoned companies, tend to be more volatile than the overall market. Forecasts are based on certain assumptions and on views of market and economic conditions which are subject to change.
Key takeaways
- The yield curve has been largely influenced by current fiscal and monetary policy, but to start off the year, it also experienced downward and upward shifts due to geopolitical and war concerns.
- We expect increases in short-maturity bond yields to remain modest and long-maturity yields to remain elevated, driven by strong U.S. economic growth, sticky inflation, and rising term premiums.
Yield curve steepness: Difference between 30-year and 2-year U.S. Treasury yields
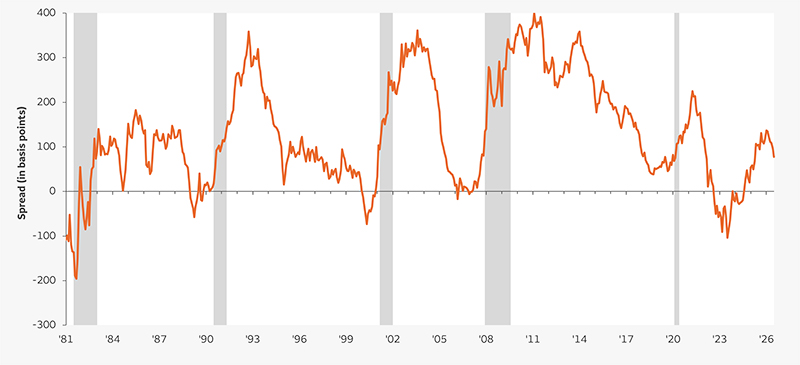 Sources: Bloomberg and Wells Fargo Investment Institute. Monthly data from January 1, 1981, to June 30, 2026. Thirty-Year Treasury Constant Maturity and the Two-Year Constant Maturity Indexes are published by the Federal Reserve Board and are based on the average yield of a range of Treasury securities, all adjusted to the equivalent of a 30-year maturity and the equivalent of a two-year maturity. Shaded area represents time frame of a U.S. economic recession. Yields represent past performance and fluctuate with market conditions. Current yields may be higher or lower than those quoted above. Past performance is no guarantee of future results. 100 basis points equal 1%. Investments in fixed-income securities are subject to interest rate, credit/default, liquidity, inflation and other risks. Bond prices fluctuate inversely to changes in interest rates. Although Treasuries are considered free from credit risk, they are subject to other types of risks. These risks include interest rate risk, which may cause the underlying value of the bond to fluctuate.
Key takeaways
- A confluence of crosscurrents — including variable inflation and economic growth, additional U.S. Treasury issuance, the amount of U.S. debt outstanding, and likely wider federal deficits particularly following tariff repeals and war — is expected to have a larger influence on the term premium.
- We believe the term premium will continue moving gradually higher, remaining in positive territory and staying away from the negative prints displayed for much of the prior 10 years.
10-year U.S. Treasury note term premium
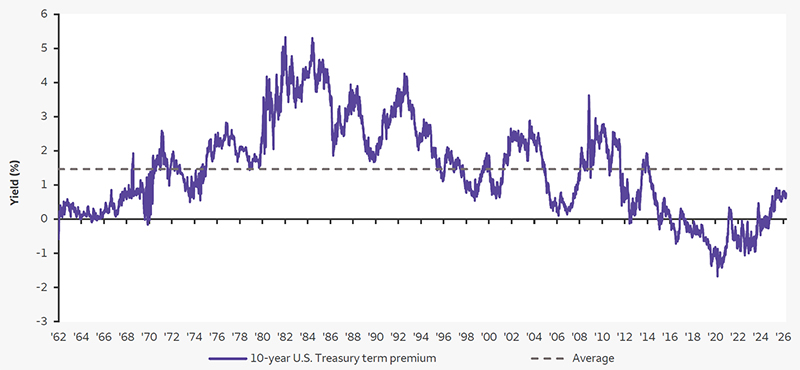 Sources: Bloomberg and Wells Fargo Investment Institute. Daily data from January 1, 1962, to June 30, 2026. Term Premium: the additional yield investors require to compensate them for the risk of holding long-term bonds over short-term debt. Past performance is no guarantee of future results. Although Treasuries are considered free from credit risk, they are subject to other types of risks. These risks include interest rate risk, which may cause the underlying value of the bond to fluctuate. New York Federal Reserve economists Tobias Adrian, Richard Crump, and Emanuel Moench (or 'ACM') present Treasury term premia estimates for maturities from one to ten years from 1961 to the present. ACM further estimates fitted yields and the expected average short-term rates for the same set of maturities. The analysis is based on a five-factor, no-arbitrage term structure model.
Asset allocation cannot eliminate the risk of fluctuating prices and uncertain returns. Diversification cannot eliminate the risk of fluctuating prices and uncertain returns.
Equity investments: Stocks offer long-term growth potential but may fluctuate more and provide less current income than other investments. An investment in the stock market should be made with an understanding of the risks associated with common stocks, including market fluctuations.
Fixed income: Investments in fixed-income securities are subject to interest rate, credit/default, liquidity, inflation, prepayment, extension, and other risks. Bond prices fluctuate inversely to changes in interest rates. Therefore, a general rise in interest rates can result in a decline in the bond’s price. Credit risk is the risk that an issuer will default on payments of interest and/or principal. High-yield fixed-income securities (junk bonds) are considered speculative, involve greater risk of default, and tend to be more volatile than investment-grade fixed-income securities. If sold prior to maturity, fixed-income securities are subject to market risk. All fixed-income investments may be worth less than their original cost upon redemption or maturity.
Foreign investments: Investing in foreign securities presents certain risks not associated with domestic investments, such as currency fluctuation, political and economic instability, and different accounting standards. This may result in greater share price volatility. These risks are heightened in emerging markets.
Sector investing can be more volatile than investments that are broadly diversified over numerous sectors of the economy and will increase a portfolio’s vulnerability to any single economic, political, or regulatory development affecting the sector. This can result in greater price volatility. Communication services companies are vulnerable to their products and services becoming outdated because of technological advancement and the innovation of competitors. Companies in the communication services sector may also be affected by rapid technology changes; pricing competition, large equipment upgrades, substantial capital requirements and government regulation and approval of products and services. In addition, companies within the industry may invest heavily in research and development which is not guaranteed to lead to successful implementation of the proposed product. There is increased risk investing in the Industrials sector. The industries within the sector can be significantly affected by general market and economic conditions, competition, technological innovation, legislation and government regulations, among other things, all of which can significantly affect a portfolio’s performance. Risks associated with the Technology sector include increased competition from domestic and international companies, unexpected changes in demand, regulatory actions, technical problems with key products, and the departure of key members of management. Technology and Internet-related stocks, especially smaller, less-seasoned companies, tend to be more volatile than the overall market. Utilities are sensitive to changes in interest rates, and the securities within the sector can be volatile and may underperform in a slow economy. The Energy sector may be adversely affected by changes in worldwide energy prices, exploration, production spending, government regulation, and changes in exchange rates, depletion of natural resources, and risks that arise from extreme weather conditions.
Global Investment Strategy (GIS) is a division of Wells Fargo Investment Institute, Inc. (WFII). WFII is a registered investment adviser and wholly owned subsidiary of Wells Fargo Bank, N.A., a bank affiliate of Wells Fargo & Company.
The information in this report was prepared by GIS. Opinions represent GIS’ opinion as of the date of this report; are for general information purposes only; and are not intended to predict or guarantee the future performance of any individual security, market sector, or the markets generally. GIS does not undertake to advise you of any change in its opinions or the information contained in this report. Wells Fargo & Company affiliates may issue reports or have opinions that are inconsistent with, and reach different conclusions from, this report.
The information contained herein constitutes general information and is not directed to, designed for, or individually tailored to any particular investor or potential investor. This material is not intended to be a client-specific suitability or best interest analysis or recommendation; an offer to participate in any investment; or a recommendation to buy, hold, or sell securities. Do not use this information as the sole basis for investment decisions. Do not select an asset class or investment product based on performance alone. Consider all relevant information, including your existing portfolio, investment objectives, risk tolerance, liquidity needs, and investment time horizon.
Wells Fargo Securities is the trade name for the capital markets and investment banking services of Wells Fargo & Company and its subsidiaries, including Wells Fargo Securities, LLC, member NYSE, FINRA and SIPC and Wells Fargo Bank, National Association.
Wells Fargo Advisors is registered with the U.S. Securities and Exchange Commission and the Financial Industry Regulatory Authority but is not licensed or registered with any financial services regulatory authority outside of the U.S. Non-U.S. residents who maintain U.S.-based financial services accounts with Wells Fargo Advisors may not be afforded certain protections conferred by legislation and regulations in their country of residence in respect of any investments, investment transactions, or communications made with Wells Fargo Advisors.
Wells Fargo Advisors is a trade name used by Wells Fargo Clearing Services, LLC, and Wells Fargo Advisors Financial Network, LLC, Members SIPC, separate registered broker/dealers and nonbank affiliates of Wells Fargo & Company.
© 2026 Wells Fargo Investment Institute. All rights reserved.